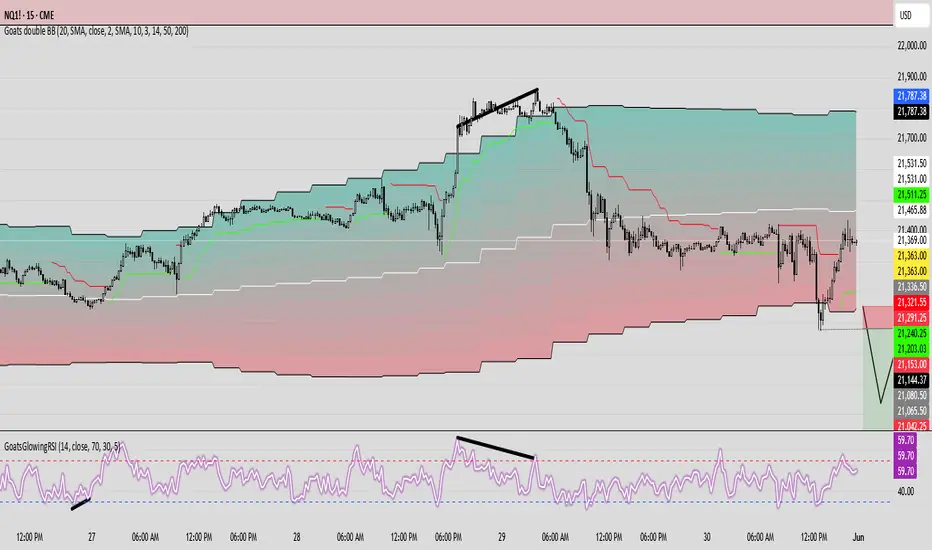
GoatsGlowingRSIGoatsGlowingRSI is a visually enhanced and feature-rich RSI (Relative Strength Index) indicator designed for deeper market insight and clearer signal visualization. It combines standard RSI analysis with gradient-colored backgrounds, glowing effects, and automated divergence detection to help traders spot potential reversals and momentum shifts more effectively.
Key Features:
✅ Multi-Timeframe RSI:
Calculate RSI from any timeframe using the custom input. Leave it blank to use the current chart's timeframe.
✅ Dynamic Gradient Background:
A smooth gradient fill is applied between RSI levels from the lower band (30) to the upper band (70). The gradient shifts from blue (oversold) to red (overbought), visually highlighting the RSI's position and strength.
✅ Glowing RSI Line:
A three-layered glow effect surrounds the main RSI line, creating a striking white core with a purple aura that enhances visibility against dark or light chart themes.
✅ Custom RSI Levels:
Dashed horizontal lines at RSI 70 (overbought), RSI 30 (oversold), and a dotted midline at 50 help you interpret trend momentum and strength.
✅ Automatic Divergence Detection:
Built-in logic identifies bullish and bearish divergences by comparing RSI and price pivot points:
🟢 Bullish Divergence: RSI makes a higher low while price makes a lower low.
🔴 Bearish Divergence: RSI makes a lower high while price makes a higher high.
Divergences are marked on the RSI line with colored lines and labels ("Bull"/"Bear").
✅ Alerts Ready:
Get notified in real-time with alert conditions for both bullish and bearish divergence setups.
Cari dalam skrip untuk "relative strength"
Fibo Normalized RSI & RSI RibbonPlots both standard and Z-score normalized RSI ribbons using Fibonacci-based periods. Supports adjustable normalization, optional 0–100 scaling, and multi-line visualizations for momentum and deviation analysis.
This tool is designed for traders who want to go beyond standard RSI by adding:
Statistical normalization (Z-score)
Multi-period analysis (Fibonacci structure)
Advanced divergence and exhaustion detection
It gives you both classical momentum context and mathematically rigorous deviation insight, making it ideal for:
Swing traders
Quant-inclined discretionary traders
Multi-timeframe analysts
Trend Confirmation
When both RSI and normalized RSI across short and long periods are stacked in the same direction (e.g., above 50 or with high Z-scores), the trend is likely strong.
Disagreement between the two ribbons (e.g., RSI high but normalized RSI flat) may indicate late-stage trend or false strength.
Mean Reversion Trades
Look for normalized RSI values > +2 or < -2 (i.e., ~2 standard deviations).
Cross-check with standard RSI to see if the move aligns with a traditional overbought/oversold level.
Great for fade/reversal setups when Z-score RSI is extreme but classic RSI is just beginning to turn.
Divergence Detection
Compare the slope of RSI vs. normalized RSI over same period:
If RSI is rising but normalized RSI is falling → momentum is fading despite apparent strength.
Excellent for early warnings before reversals.
Multi-Timeframe Confluence
Use short-period ribbons (e.g., 3–13) for tactical entries/exits.
Use long-period ribbons (e.g., 55–233) for macro trend bias.
Alignment across both = high-confidence zone.

AlphaTrend++AlphaTrend++
Overview
The AlphaTrend++ is an advanced Pine Script indicator designed to help traders identify buy and sell opportunities in trending and volatile markets. Building on trend-following principles, it uses a modified Average True Range (ATR) calculation combined with volume or momentum data to plot a dynamic trend line. The indicator overlays on the price chart, displaying a colored trend line, a filled trend zone, buy/sell signals, and optional stop-loss tick labels, making it ideal for day trading or swing trading, particularly in markets like futures (e.g., MES).
What It Does
This indicator generates buy and sell signals based on the direction and momentum of a custom trend line, filtered by optional time restrictions and signal frequency logic. The trend line adapts to price action and volatility, with a filled zone highlighting trend strength. Buy/sell signals are plotted as labels, and stop-loss distances are displayed in ticks (customizable for instruments like MES). The indicator supports standard chart types for realistic signal generation.
How It Works
The indicator employs the following components:
Trend Line Calculation: A dynamic trend line is calculated using ATR adjusted by a user-defined multiplier, combined with either Money Flow Index (MFI) or Relative Strength Index (RSI) depending on volume availability. The line tracks price movements, adjusting upward or downward based on trend direction and volatility.
Trend Zone: The area between the current trend line and its value two bars prior is filled, colored green for bullish trends (upward movement) or red for bearish trends (downward movement), providing a visual cue of trend strength.
Signal Generation: Buy signals occur when the trend line crosses above its value two bars ago, and sell signals occur when it crosses below, with optional filtering to reduce signal noise (based on bar timing logic). Signals can be restricted to a 9:00–15:00 UTC trading window.
Stop-Loss Ticks: For each signal, the indicator calculates the distance to the trend line (acting as a stop-loss level) in ticks, using a user-defined tick size (default 0.25 for MES). These are displayed as labels below/above the signal.
Time Filter: An optional filter limits signals to 9:00–15:00 UTC, aligning with active trading sessions like the US market open.
The indicator ensures compatibility with standard chart types (e.g., candlestick or bar charts) to avoid unrealistic results associated with non-standard types like Heikin Ashi or Renko.
How to Use It
Add to Chart: Apply the indicator to a candlestick or bar chart on TradingView.
Configure Settings:
Multiplier: Adjust the ATR multiplier (default 1.0) to control trend line sensitivity. Higher values widen the stop-loss distance.
Common Period: Set the ATR and MFI/RSI period (default 14) for trend calculations.
No Volume Data: Enable if volume data is unavailable (e.g., for certain forex pairs), switching from MFI to RSI.
Tick Size: Set the tick size for stop-loss calculations (default 0.25 for MES futures).
Show Buy/Sell Signals: Toggle signal labels (default enabled).
Show Stop Loss Ticks: Toggle stop-loss tick labels (default enabled).
Use Time Filter: Restrict signals to 9:00–15:00 UTC (default disabled).
Use Filtered Signals: Enable to reduce signal frequency using bar timing logic (default enabled).
Interpret Signals:
Buy Signal: A blue “BUY” label below the bar indicates a potential long entry (trend line crossover, passing filters).
Sell Signal: A red “SELL” label above the bar indicates a potential short entry (trend line crossunder, passing filters).
Trend Zone: Green fill suggests bullish momentum; red fill suggests bearish momentum.
Stop-Loss Ticks: Gray labels show the stop-loss distance in ticks, helping with risk management.
Monitor Context: Use the trend line and filled zone to confirm the market’s direction before acting on signals.
Unique Features
Adaptive Trend Line: Combines ATR with MFI or RSI to create a responsive trend line that adjusts to volatility and market conditions.
Tick-Based Stop-Loss: Displays stop-loss distances in ticks, customizable for specific instruments, aiding precise risk management.
Signal Filtering: Optional bar timing logic reduces false signals, improving reliability in choppy markets.
Trend Zone Visualization: The filled zone between trend line values enhances trend clarity, making it easier to assess momentum.
Time-Restricted Trading: Optional 9:00–15:00 UTC filter aligns signals with high-liquidity sessions.
Notes
Use on standard candlestick or bar charts to ensure accurate signals.
Test the indicator on a demo account to optimize settings for your market and timeframe.
Combine with other analysis (e.g., support/resistance, volume spikes) for better decision-making.
The indicator is not a standalone system; use it as part of a broader trading strategy.
Limitations
Signals may lag in highly volatile or low-liquidity markets due to ATR-based calculations.
The 9:00–15:00 UTC time filter may not suit all markets; disable it for 24-hour assets like forex or crypto.
Stop-loss tick calculations assume consistent tick sizes; verify compatibility with your instrument.
This indicator is designed for traders seeking a robust, trend-following tool with customizable risk management and signal filtering, optimized for active trading sessions.

RSI HeartHere's an introduction you can use for your RSI Heart indicator:
---
### RSI Heart Indicator
The **RSI Heart Indicator** provides a visually engaging way to monitor and track the **Relative Strength Index (RSI)** across multiple timeframes (10m, 15m, 30m, and 1H). It not only shows the RSI value but also uses heart-shaped symbols to reflect the current market condition based on RSI levels, making it easier to understand the strength and momentum of a given asset at a glance.
### Key Features:
- **Multi-Timeframe Support**: The indicator pulls the RSI values from multiple timeframes (10 minutes, 15 minutes, 30 minutes, and 1 hour) so you can analyze market strength at different intervals in one view.
- **Heart Symbols**: RSI values are displayed alongside heart emojis (❤️, 💛, 💚) that provide a visual cue for the market condition:
- **❤️ (Overbought or Oversold)**: When RSI is below 27 or above 73.
- **💛 (Near Oversold/Overbought)**: When RSI is between 27-30 or 70-73.
- **💚 (Neutral)**: When RSI is between 30 and 70.
- **Customizable Visibility**: Toggle visibility for each timeframe's RSI using simple on/off settings, giving you control over which timeframes are displayed in your chart.
### How it Can Help:
- **Quick Market Sentiment Analysis**: The heart symbols and RSI values allow you to quickly assess whether an asset is in an overbought or oversold condition.
- **Multi-Timeframe RSI**: By viewing RSI across multiple timeframes, you can gain a more comprehensive understanding of market momentum and strength.
- **Personalized to Your Preferences**: Adjust the settings to only show the timeframes that matter most to you, creating a customized and clean chart view.
This indicator helps traders make more informed decisions by providing a clear, easy-to-read representation of market conditions across various timeframes, all within one indicator.
---
This introduction explains what the indicator does, its features, and how it can benefit traders in a concise and easy-to-understand way.

Stock versus IndustryStock vs. Industry Indicator
The Stock vs. Industry Indicator is designed to help traders assess the performance of individual stocks relative to their respective industries. This tool automatically identifies the industry classification of a stock, compares it to a relevant industry ETF, and calculates the stock-to-industry performance ratio in real-time.
Key Features:
Real-Time Performance Comparison: The indicator tracks and compares the price movement of an individual stock against the most relevant ETF for its industry, providing a dynamic view of relative strength.
Stock-to-Industry Ratio: Displays the ratio of stock performance versus industry performance, allowing traders to easily identify outperforming and underperforming stocks within their industry.
SMA Trend Line: The indicator includes a simple moving average (SMA) trend line to assist with visual trend analysis, offering additional context to the stock’s movement in relation to the broader industry.
Customizable Parameters: Users can customize SMA periods, adjust comparison overrides, and use color highlighting to suit their trading preferences and strategies.
Industry Classification: Automatically assigns the correct industry classification to any stock, providing a reliable and automated method for comparing stocks within the same industry.
Benefits:
Identify Leaders and Laggards: Easily distinguish which stocks are outperforming their industry and which are underperforming. This allows traders to make more informed decisions based on relative strength.
Sector Rotation Detection: The indicator helps detect when a stock begins to underperform its industry, which can signal a shift in sector strength. This allows traders to adjust their positions and strategies accordingly.
Breakout Confirmation: When a stock breaks out while outperforming its industry, the indicator provides additional confidence in the breakout’s validity and potential for continued performance.
Avoid Value Traps: By comparing a stock’s performance against its industry, the indicator helps avoid investing in stocks that appear undervalued but are underperforming relative to their peers, reducing the risk of falling into value traps.
Usage:
Timeframes: The indicator works across various timeframes and is adaptable for both short-term and long-term traders.
Customization: Users can modify the parameters and settings to align with their specific trading style, whether day trading or position trading.
Visual Aid: The indicator provides an intuitive chart display, making it easy to understand a stock’s performance relative to its industry at a glance.
Disclaimer:
This indicator does not guarantee future performance or predict market movements. The information provided is based on historical data and current market conditions, which can change rapidly. It is important to use this tool as part of a broader trading strategy, taking into account other market factors and risk management techniques.

RSI & EMA IndicatorMulti-Timeframe EMA & RSI Analysis with Trend Merging Detection
Overview
This script provides traders with a multi-timeframe analysis tool that simplifies trend detection, momentum confirmation, and potential trend shifts. It integrates Exponential Moving Averages (EMAs) and the Relative Strength Index (RSI) across Daily, Weekly, and Monthly timeframes, helping traders assess both long-term and short-term market conditions at a glance.
This script is a simplification and modification of the EMA Cheatsheet by MarketMoves, reducing chart clutter while adding EMA merging detection to highlight potential trend reversals or breakouts.
Originality and Usefulness
Unlike traditional indicators, which focus on a single timeframe, this script combines multiple timeframes in a single view to offer a comprehensive market outlook.
What Makes This Indicator Unique?
This Indicator to Combine RSI and EMA Clouds for Multiple Timeframes
Multi-Timeframe Trend Analysis in One Visual Tool
EMA Merging Detection to Spot Trend Shifts Early
Momentum Validation Using RSI Across Daily, Weekly, and Monthly Timeframes
Reduces Chart Clutter While Providing Actionable Trade Signals
I couldn't find a TradingView indicator that displayed RSI and EMA clouds together across Daily, Weekly, and Monthly timeframes. This tool bridges that gap, allowing traders to see trend strength and momentum shifts across key timeframes without switching charts.
How the Script Works
1. Trend Direction via EMAs
The script tracks Short-term (5 & 12-period), Medium-term (34 & 50-period), and Long-term (72 & 89-period) EMAs across Daily, Weekly, and Monthly timeframes.
Bullish trend: When faster EMAs are above slower EMAs.
Bearish trend: When faster EMAs are below slower EMAs.
A visual table simplifies trend recognition with:
Green cells for bullish alignment.
Red cells for bearish alignment.
This color-coded system allows traders to quickly assess market momentum across different timeframes without excessive manual analysis.
2. Momentum Confirmation with RSI
The RSI(14) values for Daily, Weekly, and Monthly timeframes are displayed alongside the EMAs.
RSI above 70 suggests overbought conditions.
RSI below 30 suggests oversold conditions.
By combining RSI with EMA trends, traders can confirm whether momentum supports the trend direction or if the market is losing strength.
3. Trend Shift Detection (EMA Merging Mechanism)
A unique feature of this script is EMA merging detection, which occurs when:
The short, medium, and long-term EMAs come within 0.5% of the price.
This often signals trend reversals, breakouts, or consolidations.
When this condition is met, a warning signal appears, alerting traders to potential market shifts.
Who This Indicator Is For?
This script is designed for traders who want to track trends across multiple timeframes while keeping a clean and simplified chart.
Swing & Position Traders – Identify strong trends and potential momentum shifts for longer-term trades.
Trend Followers – Stay aligned with major market trends and avoid trading against momentum.
Day Traders – Use the Daily timeframe for entries while referencing higher timeframes for confirmation.
How to Use the Indicator
Add the indicator to any chart.
Check the trend table in the top-right corner:
Green cells indicate a bullish trend.
Red cells indicate a bearish trend.
Look at RSI values to confirm momentum:
RSI above 70 = Overbought.
RSI below 30 = Oversold.
Watch for the "Merge" alert to spot potential reversals or consolidations.
Combine signals from multiple timeframes for stronger trade decisions.
Why This Indicator is Unique on TradingView?
Before this script, no TradingView indicator displayed RSI and EMA clouds together across multiple timeframes (Daily, Weekly, Monthly).
This tool eliminates the need to:
Manually check multiple timeframes for trend alignment.
Add multiple EMA and RSI indicators to the same chart, creating clutter.
Constantly switch between different timeframes to confirm momentum and trend direction.
With this indicator, traders can see trend strength and momentum shifts instantly, improving their decision-making process.
Chart Guidelines
The script is designed for use on a clean chart to maximize clarity.
The trend alignment table is displayed in a non-intrusive manner so traders can focus on price action.
No additional indicators are required, but users may combine this script with volume-based indicators for further confirmation.
The script name and timeframe should always be visible on published charts to help traders understand the analysis.
Final Notes
This script is a simplification and modification of the EMA Cheatsheet by MarketMoves, improving trend detection, momentum confirmation, and EMA merging detection.
It is designed to help traders quickly identify trend direction, confirm momentum, and detect potential trend shifts, reducing the need for excessive manual analysis.
Disclaimer: This indicator is for educational purposes only and does not constitute financial advice. Trading involves risk; always use proper risk management when applying this tool in live markets.

MTF Signal XpertMTF Signal Xpert – Detailed Description
Overview:
MTF Signal Xpert is a proprietary, open‑source trading signal indicator that fuses multiple technical analysis methods into one cohesive strategy. Developed after rigorous backtesting and extensive research, this advanced tool is designed to deliver clear BUY and SELL signals by analyzing trend, momentum, and volatility across various timeframes. Its integrated approach not only enhances signal reliability but also incorporates dynamic risk management, helping traders protect their capital while navigating complex market conditions.
Detailed Explanation of How It Works:
Trend Detection via Moving Averages
Dual Moving Averages:
MTF Signal Xpert computes two moving averages—a fast MA and a slow MA—with the flexibility to choose from Simple (SMA), Exponential (EMA), or Hull (HMA) methods. This dual-MA system helps identify the prevailing market trend by contrasting short-term momentum with longer-term trends.
Crossover Logic:
A BUY signal is initiated when the fast MA crosses above the slow MA, coupled with the condition that the current price is above the lower Bollinger Band. This suggests that the market may be emerging from a lower price region. Conversely, a SELL signal is generated when the fast MA crosses below the slow MA and the price is below the upper Bollinger Band, indicating potential bearish pressure.
Recent Crossover Confirmation:
To ensure that signals reflect current market dynamics, the script tracks the number of bars since the moving average crossover event. Only crossovers that occur within a user-defined “candle confirmation” period are considered, which helps filter out outdated signals and improves overall signal accuracy.
Volatility and Price Extremes with Bollinger Bands
Calculation of Bands:
Bollinger Bands are calculated using a 20‑period simple moving average as the central basis, with the upper and lower bands derived from a standard deviation multiplier. This creates dynamic boundaries that adjust according to recent market volatility.
Signal Reinforcement:
For BUY signals, the condition that the price is above the lower Bollinger Band suggests an undervalued market condition, while for SELL signals, the price falling below the upper Bollinger Band reinforces the bearish bias. This volatility context adds depth to the moving average crossover signals.
Momentum Confirmation Using Multiple Oscillators
RSI (Relative Strength Index):
The RSI is computed over 14 periods to determine if the market is in an overbought or oversold state. Only readings within an optimal range (defined by user inputs) validate the signal, ensuring that entries are made during balanced conditions.
MACD (Moving Average Convergence Divergence):
The MACD line is compared with its signal line to assess momentum. A bullish scenario is confirmed when the MACD line is above the signal line, while a bearish scenario is indicated when it is below, thus adding another layer of confirmation.
Awesome Oscillator (AO):
The AO measures the difference between short-term and long-term simple moving averages of the median price. Positive AO values support BUY signals, while negative values back SELL signals, offering additional momentum insight.
ADX (Average Directional Index):
The ADX quantifies trend strength. MTF Signal Xpert only considers signals when the ADX value exceeds a specified threshold, ensuring that trades are taken in strongly trending markets.
Optional Stochastic Oscillator:
An optional stochastic oscillator filter can be enabled to further refine signals. It checks for overbought conditions (supporting SELL signals) or oversold conditions (supporting BUY signals), thus reducing ambiguity.
Multi-Timeframe Verification
Higher Timeframe Filter:
To align short-term signals with broader market trends, the script calculates an EMA on a higher timeframe as specified by the user. This multi-timeframe approach helps ensure that signals on the primary chart are consistent with the overall trend, thereby reducing false signals.
Dynamic Risk Management with ATR
ATR-Based Calculations:
The Average True Range (ATR) is used to measure current market volatility. This value is multiplied by a user-defined factor to dynamically determine stop loss (SL) and take profit (TP) levels, adapting to changing market conditions.
Visual SL/TP Markers:
The calculated SL and TP levels are plotted on the chart as distinct colored dots, enabling traders to quickly identify recommended exit points.
Optional Trailing Stop:
An optional trailing stop feature is available, which adjusts the stop loss as the trade moves favorably, helping to lock in profits while protecting against sudden reversals.
Risk/Reward Ratio Calculation:
MTF Signal Xpert computes a risk/reward ratio based on the dynamic SL and TP levels. This quantitative measure allows traders to assess whether the potential reward justifies the risk associated with a trade.
Condition Weighting and Signal Scoring
Binary Condition Checks:
Each technical condition—ranging from moving average crossovers, Bollinger Band positioning, and RSI range to MACD, AO, ADX, and volume filters—is assigned a binary score (1 if met, 0 if not).
Cumulative Scoring:
These individual scores are summed to generate cumulative bullish and bearish scores, quantifying the overall strength of the signal and providing traders with an objective measure of its viability.
Detailed Signal Explanation:
A comprehensive explanation string is generated, outlining which conditions contributed to the current BUY or SELL signal. This explanation is displayed on an on‑chart dashboard, offering transparency and clarity into the signal generation process.
On-Chart Visualizations and Debug Information
Chart Elements:
The indicator plots all key components—moving averages, Bollinger Bands, SL and TP markers—directly on the chart, providing a clear visual framework for understanding market conditions.
Combined Dashboard:
A dedicated dashboard displays key metrics such as RSI, ADX, and the bullish/bearish scores, alongside a detailed explanation of the current signal. This consolidated view allows traders to quickly grasp the underlying logic.
Debug Table (Optional):
For advanced users, an optional debug table is available. This table breaks down each individual condition, indicating which criteria were met or not met, thus aiding in further analysis and strategy refinement.
Mashup Justification and Originality
MTF Signal Xpert is more than just an aggregation of existing indicators—it is an original synthesis designed to address real-world trading complexities. Here’s how its components work together:
Integrated Trend, Volatility, and Momentum Analysis:
By combining moving averages, Bollinger Bands, and multiple oscillators (RSI, MACD, AO, ADX, and an optional stochastic), the indicator captures diverse market dynamics. Each component reinforces the others, reducing noise and filtering out false signals.
Multi-Timeframe Analysis:
The inclusion of a higher timeframe filter aligns short-term signals with longer-term trends, enhancing overall reliability and reducing the potential for contradictory signals.
Adaptive Risk Management:
Dynamic stop loss and take profit levels, determined using ATR, ensure that the risk management strategy adapts to current market conditions. The optional trailing stop further refines this approach, protecting profits as the market evolves.
Quantitative Signal Scoring:
The condition weighting system provides an objective measure of signal strength, giving traders clear insight into how each technical component contributes to the final decision.
How to Use MTF Signal Xpert:
Input Customization:
Adjust the moving average type and period settings, ATR multipliers, and oscillator thresholds to align with your trading style and the specific market conditions.
Enable or disable the optional stochastic oscillator and trailing stop based on your preference.
Interpreting the Signals:
When a BUY or SELL signal appears, refer to the on‑chart dashboard, which displays key metrics (e.g., RSI, ADX, bullish/bearish scores) along with a detailed breakdown of the conditions that triggered the signal.
Review the SL and TP markers on the chart to understand the associated risk/reward setup.
Risk Management:
Use the dynamically calculated stop loss and take profit levels as guidelines for setting your exit points.
Evaluate the provided risk/reward ratio to ensure that the potential reward justifies the risk before entering a trade.
Debugging and Verification:
Advanced users can enable the debug table to see a condition-by-condition breakdown of the signal generation process, helping refine the strategy and deepen understanding of market dynamics.
Disclaimer:
MTF Signal Xpert is intended for educational and analytical purposes only. Although it is based on robust technical analysis methods and has undergone extensive backtesting, past performance is not indicative of future results. Traders should employ proper risk management and adjust the settings to suit their financial circumstances and risk tolerance.
MTF Signal Xpert represents a comprehensive, original approach to trading signal generation. By blending trend detection, volatility assessment, momentum analysis, multi-timeframe alignment, and adaptive risk management into one integrated system, it provides traders with actionable signals and the transparency needed to understand the logic behind them.

Dynamic RSI Bollinger Bands with Waldo Cloud
TradingView Indicator Description: Dynamic RSI Bollinger Bands with Waldo Cloud
Title: Dynamic RSI Bollinger Bands with Waldo Cloud
Short Title: Dynamic RSI BB Waldo
Overview:
Introducing an experimental indicator, the Dynamic RSI Bollinger Bands with Waldo Cloud, designed for adventurous traders looking to explore new dimensions in technical analysis. This indicator overlays on your chart, providing a unique perspective by integrating the Relative Strength Index (RSI) with Bollinger Bands, creating a dynamic trading tool that adapts to market conditions through the lens of momentum and volatility.
What is it?
This innovative indicator combines the traditional Bollinger Bands with the RSI in a way that hasn't been commonly explored. Here's a breakdown:
RSI Integration: The RSI is calculated with customizable length settings, and its values are used not just for momentum analysis but as the basis for the Bollinger Bands. This means the position and width of the bands are directly influenced by the RSI, offering a visual representation of momentum within the context of price volatility.
Dynamic Bollinger Bands: Instead of using price directly, the Bollinger Bands are calculated using a scaled version of the RSI. This scaling is done to fit the RSI values into the price range, ensuring the bands are relevant to the actual price movement. The standard deviation for these bands is also scaled accordingly, providing a unique volatility measure that's momentum-driven.
Waldo Cloud: Named after a visual representation concept, the 'Waldo Cloud' refers to the colored area between the Bollinger Bands, which changes based on various conditions:
Purple when RSI is overbought.
Blue when RSI is oversold.
Green for bullish conditions, defined by the fast-moving average crossing above the slow one, RSI is bullish, and the price is above the slow MA.
Red for bearish conditions, when the fast MA crosses below the slow MA, the RSI is bearish, and the price is below the slow MA.
Gray for neutral market conditions.
Moving Averages: Two simple moving averages (Fast MA and Slow MA) are included, which can be toggled on or off, offering additional trend analysis through crossovers.
How to Use It:
Given its experimental nature, this indicator should be used with caution and in conjunction with other analysis methods:
Identifying Market Conditions: Use the color of the Waldo Cloud to gauge market sentiment. A green cloud might suggest a good time to consider long positions, while a red cloud could indicate potential shorting opportunities. Purple and blue clouds highlight extreme conditions that might precede reversals.
Volatility and Momentum: The dynamic nature of the Bollinger Bands based on RSI provides insight into how momentum is affecting price volatility. When the bands are wide, it might indicate high momentum and potential trend continuation or reversal, depending on the RSI's position relative to its overbought/oversold levels.
Trend Confirmation: The moving average crossovers can act as confirmation signals. For instance, a bullish crossover (fast MA over slow MA) within a green cloud might strengthen a buy signal, whereas a bearish crossover in a red cloud might reinforce a sell decision.
Customization: Adjust the RSI length, overbought/oversold levels, and moving average lengths to suit different trading styles or market conditions. Experiment with these settings to find what works best for your strategy.
Combining with Other Indicators: Since this is an experimental tool, it's advisable to use it alongside established indicators like traditional Bollinger Bands, MACD, or trend lines to validate signals.
Conclusion:
The Dynamic RSI Bollinger Bands with Waldo Cloud is an experimental venture into combining momentum with volatility visually and interactively. It's designed for traders who are open to exploring new methods of market analysis.
Remember, due to its experimental status, this indicator should be part of a broader trading strategy, and backtesting or paper trading is recommended before applying it in live trading scenarios. Keep an eye on how the market reacts to the signals provided by this indicator and always consider risk management practices.

RSI Crossover dipali parikhThis script generates buy and sell signals based on the crossover of the Relative Strength Index (RSI) and the RSI-based Exponential Moving Average (EMA). It also includes an additional condition for both buy and sell signals that the RSI-based EMA must be either above or below 50.
Key Features:
Buy Signal: Triggered when:
The RSI crosses above the RSI-based EMA.
The RSI-based EMA is above 50.
A green "BUY" label will appear below the bar when the buy condition is met.
Sell Signal: Triggered when:
The RSI crosses below the RSI-based EMA.
The RSI-based EMA is below 50.
A red "SELL" label will appear above the bar when the sell condition is met.
Customizable Inputs:
RSI Length: Adjust the period for calculating the RSI (default is 14).
RSI-based EMA Length: Adjust the period for calculating the RSI-based EMA (default is 9).
RSI Threshold: Adjust the threshold (default is 50) for when the RSI-based EMA must be above or below.
Visuals:
The RSI is plotted as a blue line.
The RSI-based EMA is plotted as an orange line.
Buy and sell signals are indicated by green "BUY" and red "SELL" labels.
Alerts:
Alerts can be set for both buy and sell conditions to notify you when either condition is met.
How to Use:
Use this script to identify potential buy and sell opportunities based on the behavior of the RSI relative to its EMA.
The buy condition indicates when the RSI is strengthening above its EMA, and the sell condition signals when the RSI is weakening below its EMA.
Strategy Use:
Ideal for traders looking to leverage RSI momentum for entering and exiting positions.
The RSI-based EMA filter helps smooth out price fluctuations, focusing on stronger signals.
This script is designed for both discretionary and algorithmic traders, offering a simple yet effective method for spotting trend reversals and continuation opportunities using RSI.

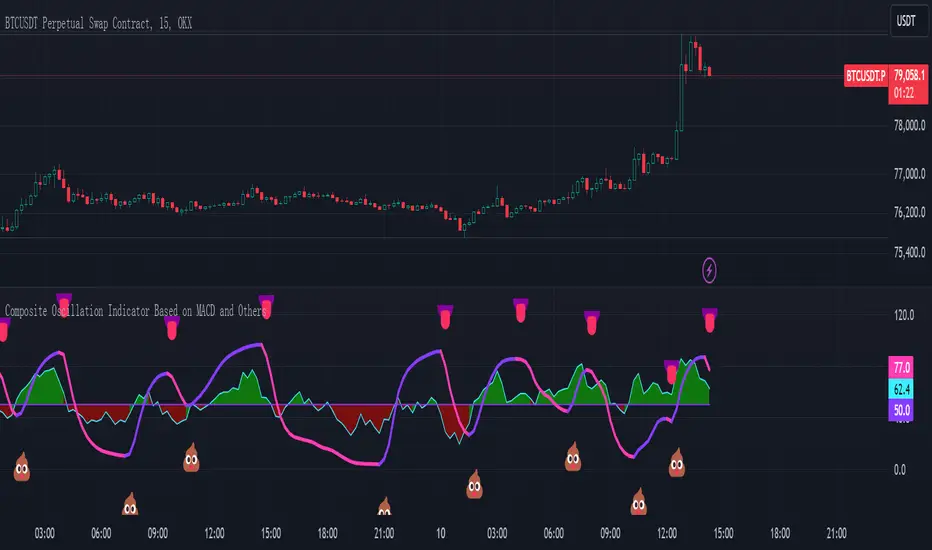
Composite Oscillation Indicator Based on MACD and OthersThis indicator combines various technical analysis tools to create a composite oscillator that aims to capture multiple aspects of market behavior. Here's a breakdown of its components:
* Individual RSIs (xxoo1-xxoo15): The code calculates the RSI (Relative Strength Index) of numerous indicators, including volume-based indicators (NVI, PVI, OBV, etc.), price-based indicators (CCI, CMO, etc.), and moving averages (WMA, ALMA, etc.). It also includes the RSI of the MACD histogram (xxoo14).
* Composite RSI (xxoojht): The individual RSIs are then averaged to create a composite RSI, aiming to provide a more comprehensive view of market momentum and potential turning points.
* MACD Line RSI (xxoo14): The RSI of the MACD histogram incorporates the momentum aspect of the MACD indicator into the composite measure.
* Double EMA (co, coo): The code employs two Exponential Moving Averages (EMAs) of the composite RSI, with different lengths (9 and 18 periods).
* Difference (jo): The difference between the two EMAs (co and coo) is calculated, aiming to capture the rate of change in the composite RSI.
* Smoothed Difference (xxp): The difference (jo) is further smoothed using another EMA (9 periods) to reduce noise and enhance the signal.
* RSI of Smoothed Difference (cco): Finally, the RSI is applied to the smoothed difference (xxp) to create the core output of the indicator.
Market Applications and Trading Strategies:
* Overbought/Oversold: The indicator's central line (plotted at 50) acts as a reference for overbought/oversold conditions. Values above 50 suggest potential overbought zones, while values below 50 indicate oversold zones.
* Crossovers and Divergences: Crossovers of the cco line above or below its previous bar's value can signal potential trend changes. Divergences between the cco line and price action can also provide insights into potential trend reversals.
* Emoji Markers: The code adds emoji markers ("" for bullish and "" for bearish) based on the crossover direction of the cco line. These can provide a quick visual indication of potential trend shifts.
* Colored Fill: The area between the composite RSI line (xxoojht) and the central line (50) is filled with color to visually represent the prevailing market sentiment (green for above 50, red for below 50).
Trading Strategies (Examples):
* Long Entry: Consider a long entry (buying) signal when the cco line crosses above its previous bar's value and the composite RSI (xxoojht) is below 50, suggesting a potential reversal from oversold conditions.
* Short Entry: Conversely, consider a short entry (selling) signal when the cco line crosses below its previous bar's value and the composite RSI (xxoojht) is above 50, suggesting a potential reversal from overbought conditions.
* Confirmation: Always combine the indicator's signals with other technical analysis tools and price action confirmation for better trade validation.
Additional Notes:
* The indicator offers a complex combination of multiple indicators. Consider testing and optimizing the parameters (EMAs, RSI periods) to suit your trading style and market conditions.
* Backtesting with historical data can help assess the indicator's effectiveness and identify potential strengths and weaknesses in different market environments.
* Remember that no single indicator is perfect, and the cco indicator should be used in conjunction with other forms of analysis to make informed trading decisions.
By understanding the logic behind this composite oscillator and its potential applications, you can incorporate it into your trading strategy to potentially identify trends, gauge market sentiment, and generate trading signals.
Tare's Multi-Timeframe Market Heatmap
Tare's Multi-Timeframe Market Heatmap is a powerful tool designed to help traders quickly gauge market sentiment across multiple timeframes using a combination of RSI (Relative Strength Index) and MACD (Moving Average Convergence Divergence) indicators. This indicator analyzes four customizable timeframes to determine whether the market is bullish or bearish, providing a visual heatmap to indicate the overall market direction and strength.
Key Features:
Multi-Timeframe Analysis: The indicator allows you to select up to four different timeframes (e.g., 5 minutes, 15 minutes, 30 minutes, 1 hour) to analyze the market's behavior comprehensively.
RSI and MACD Integration: By combining RSI and MACD indicators, the heatmap provides a more robust analysis, taking into account both momentum (RSI) and trend (MACD) indicators. This dual approach helps in identifying stronger and more reliable signals.
Visual Heatmap: The indicator plots a histogram that changes color and intensity based on the combined bullish or bearish strength across the selected timeframes:
Green: Indicates bullish strength, with a darker shade representing stronger bullish signals across multiple timeframes.
Red: Indicates bearish strength, with a darker shade representing stronger bearish signals across multiple timeframes.
Customizable Settings: You can customize the length settings for RSI and MACD, including the RSI period, MACD fast and slow lengths, and signal length, allowing for tailored analysis based on your trading strategy.
Signal Exposure for Other Strategies: The indicator exposes both bullish and bearish signals, which can be used as inputs for other custom strategies within TradingView. This feature allows seamless integration and enhances the versatility of your trading approach.
How to Use:
Adjust the timeframes and indicator settings in the indicator's input menu to match your trading style.
Observe the color and intensity of the histogram to understand the current market sentiment across the selected timeframes.
Utilize the exposed signals (bullish and bearish) in conjunction with other strategies or indicators for a more comprehensive trading system.
Tare's Multi-Timeframe Market Heatmap provides traders with a clear, concise, and customizable overview of market conditions, making it an essential tool for multi-timeframe analysis and decision-making.

Wall Street Cheat Sheet IndicatorThe Wall Street Cheat Sheet Indicator is a unique tool designed to help traders identify the psychological stages of the market cycle based on the well-known Wall Street Cheat Sheet. This indicator integrates moving averages and RSI to dynamically label market stages, providing clear visual cues on the chart.
Key Features:
Dynamic Stage Identification: The indicator automatically detects and labels market stages such as Disbelief, Hope, Optimism, Belief, Thrill, Euphoria, Complacency, Anxiety, Denial, Panic, Capitulation, Anger, and Depression. These stages are derived from the emotional phases of market participants, helping traders anticipate market movements.
Technical Indicators: The script uses two key technical indicators:
200-day Simple Moving Average (SMA): Helps identify long-term market trends.
50-day Simple Moving Average (SMA): Aids in recognizing medium-term trends.
Relative Strength Index (RSI): Assesses the momentum and potential reversal points based on overbought and oversold conditions.
Clear Visual Labels: The current market stage is displayed directly on the chart, making it easy to spot trends and potential turning points.
Usefulness:
This indicator is not just a simple mashup of existing tools. It uniquely combines the concept of market psychology with practical technical analysis tools (moving averages and RSI). By labeling the psychological stages of the market cycle, it provides traders with a deeper understanding of market sentiment and potential future movements.
How It Works:
Disbelief: Detected when the price is below the 200-day SMA and RSI is in the oversold territory, indicating a potential bottom.
Hope: Triggered when the price crosses above the 50-day SMA, with RSI starting to rise but still below 50, suggesting an early uptrend.
Optimism: Occurs when the price is above the 50-day SMA and RSI is between 50 and 70, indicating a strengthening trend.
Belief: When the price is well above the 50-day SMA and RSI is between 70 and 80, showing strong bullish momentum.
Thrill and Euphoria: Identified when RSI exceeds 80, indicating overbought conditions and potential for a peak.
Complacency to Depression: These stages are identified based on price corrections and drops relative to moving averages and declining RSI values.
Best Practices:
High-Time Frame Focus: This indicator works best on high-time frame charts, specifically the 1-week Bitcoin (BTCUSDT) chart. The longer time frame provides a clearer picture of the overall market cycle and reduces noise.
Trend Confirmation: Use in conjunction with other technical analysis tools such as trendlines, Fibonacci retracement levels, and support/resistance zones for more robust trading strategies.
How to Use:
Add the Indicator: Apply the Wall Street Cheat Sheet Indicator to your TradingView chart.
Analyze Market Stages: Observe the dynamic labels indicating the current stage of the market cycle.
Make Informed Decisions: Use the insights from the indicator to time your entries and exits, aligning your trades with the market sentiment.
This indicator is a valuable tool for traders looking to understand market psychology and make informed trading decisions based on the stages of the market cycle.

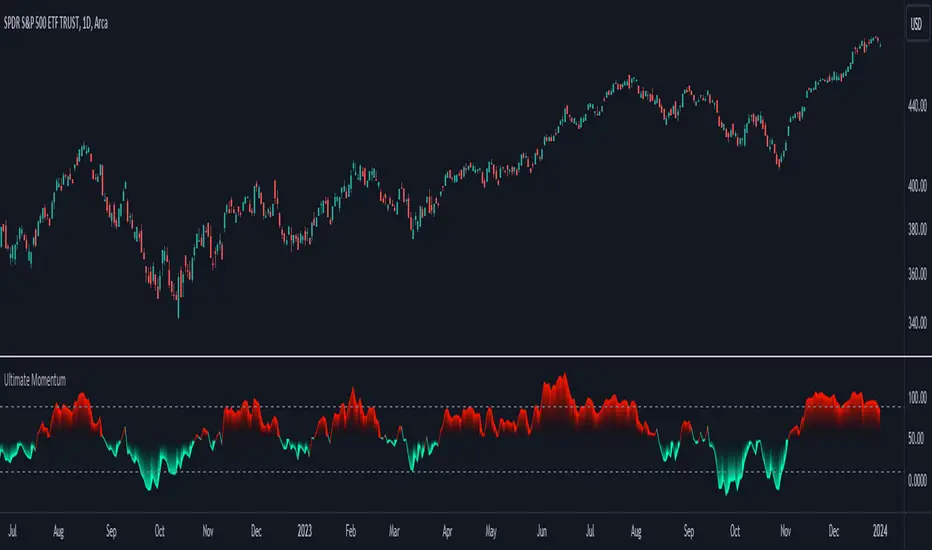
Ultimate Momentum"Ultimate Momentum" – Elevating Your Momentum Analysis
Experience a refined approach to momentum analysis with "Ultimate Momentum," a sophisticated indicator seamlessly combining the strengths of RSI and CCI. This tool offers a nuanced understanding of market dynamics with the following features:
1. Harmonious Fusion: Witness the dynamic interplay between RSI and CCI, providing a comprehensive understanding of market nuances.
2. Optimized CCI Dynamics: Delve confidently into market intricacies with optimized CCI parameters, enhancing synergy with RSI for a nuanced perspective on trends.
3. Standardized Readings: "Ultimate Momentum" standardizes RSI and CCI, ensuring consistency and reliability in readings for refined signals.
4. Native TradingView Integration: Immerse yourself in the reliability of native TradingView codes for RSI and CCI, ensuring stability and compatibility.
How RSI and CCI Work Together:
RSI (Relative Strength Index): Captures price momentum with precision, measuring the speed and change of price movements.
CCI (Commodity Channel Index): Strategically integrated to complement RSI, offering a unique perspective on price fluctuations and potential trend reversals.
Why "Ultimate Momentum"?
In a crowded landscape, "Ultimate Momentum" stands out, redefining how traders interpret momentum. Gain a profound understanding of market dynamics, spot trend reversals, and make informed decisions.
Your Insights Matter:
Share your suggestions to enhance "Ultimate Momentum" in the comments. Your feedback is crucial as we strive to deliver an unparalleled momentum analysis tool.
Risk Reward Optimiser [ChartPrime]█ CONCEPTS
In modern day strategy optimization there are few options when it comes to optimizing a risk reward ratio. Users frequently need to experiment and go through countless permutations in order to tweak, adjust and find optimal in their data.
Therefore we have created the Risk Reward Optimizer.
The Risk Reward Optimizer is a technical tool designed to provide traders with comprehensive insights into their trading strategies.
It offers a range of features and functionalities aimed at enhancing traders' decision-making process.
With a focus on comprehensive data, it is there to help traders quickly and efficiently locate Risk Reward optimums for inbuilt of custom strategies.
█ Internal and external Signals:
The script can optimize risk to reward ratio for any type of signals
You can utilize the following :
🔸Internal signals ➞ We have included a number of common indicators into the optimizer such as:
▫️ Aroon
▫️ AO (Awesome Oscillator)
▫️ RSI (Relative Strength Index)
▫️ MACD (Moving Average Convergence Divergence)
▫️ SuperTrend
▫️ Stochastic RSI
▫️ Stochastic
▫️ Moving averages
All these indicators have 3 conditions to generate signals :
Crossover
High Than
Less Than
🔸External signal
▫️ by incorporating your own indicators into the analysis. This flexibility enables you to tailor your strategy to your preferences.
◽️ How to link your signal with the optimizer:
In order to be able to analysis your signal we need to read it and to do so we would need to PLOT your signal with a defined value
plot( YOUR LONG Condition ? 100 : 0 , display = display.data_window)
█ Customizable Risk to Reward Ratios:
This tool allows you to test seven different customizable risk to reward ratios , helping you determine the most suitable risk-reward balance for your trading strategy. This data-driven approach takes the guesswork out of setting stop-loss and take-profit levels.
█ Comprehensive Data Analysis:
The tool provides a table displaying key metrics, including:
Total trades
Wins
Losses
Profit factor
Win rate
Profit and loss (PNL)
This data is essential for refining your trading strategy.
🔸 It includes a tooltip for each risk to reward ratio which gives data for the:
Most Profitable Trade USD value
Most Profitable Trade % value
Most Profitable Trade Bar Index
Most Profitable Trade Time (When it occurred)
Position and size is adjustable
█ Visual insights with histograms:
Visualize your trading performance with histograms displaying each risk to reward ratio trade space, showing total trades, wins, losses, and the ratio of profitable trades.
This visual representation helps you understand the strengths and weaknesses of your strategy.
It offers tooltips for each RR ratio with the average win and loss percentages for further analysis.
█ Dynamic Highlighting:
A drop-down menu allows you to highlight the maximum values of critical metrics such as:
Profit factor
Win rate
PNL
for quick identification of successful setups.
█ Stop Loss Flexibility:
You can adjust stop-loss levels using three different calculation methods:
ATR
Pivot
VWAP
This allows you to align risk-reward ratios with your preferred risk tolerance.
█ Chart Integration:
Visualize your trades directly on your price chart, with each trade displayed in a distinct color for easy tracking.
When your take-profit (TP) level is reached , the tool labels the corresponding risk-reward ratio for that specific TP, simplifying trade management.
█ Detailed Tooltips:
Tooltips provide deeper insights into your trading performance. They include information about the most profitable trade, such as the time it occurred, the bar index, and the percentage gain. Histogram tooltips also offer average win and loss percentages for further analysis.
█ Settings:
█ Code:
In summary, the Risk Reward Optimizer is a data-driven tool that offers traders the ability to optimize their risk-reward ratios, refine their strategies, and gain a deeper understanding of their trading performance. Whether you're a day trader, swing trader, or investor, this tool can help you make informed decisions and improve your trading outcomes.

Divergance Based on Vortex IndicatorThe Vortex-Based Divergence Indicator represents a groundbreaking approach to analyzing market dynamics within the realm of technical analysis. Drawing inspiration from the concept of vortices and their cyclical patterns, this indicator strives to illuminate potential divergence points within financial markets, providing traders with valuable insights for informed decision-making.
At its foundation, the Vortex-Based Divergence Indicator builds upon the principles of the Vortex Indicator, a well-established tool for gauging momentum and identifying potential trend reversals. However, this innovative indicator goes a step further by focusing on the divergences that can occur between the Vortex Indicator and the actual price movements.
Divergences, which arise when the direction of an indicator's movement contradicts the direction of price action, hold paramount significance within the Vortex-Based Divergence Indicator. By integrating this indicator with other renowned oscillators, such as the Relative Strength Index (RSI) or the Moving Average Convergence Divergence (MACD), traders can augment their analytical capabilities significantly.
These complementary oscillators can corroborate or validate the signals generated by the Vortex-Based Divergence Indicator. For instance, when the Vortex-Based Divergence Indicator hints at a potential trend reversal, cross-referencing this insight with the RSI's overbought or oversold levels can enhance the accuracy of the prediction. Likewise, employing the MACD to confirm momentum shifts in conjunction with the Vortex Indicator's signals can provide a more comprehensive view of market dynamics.
It's crucial to emphasize the importance of synergy when combining these indicators. Rather than relying solely on the Vortex-Based Divergence Indicator, incorporating other oscillators acts as a checks-and-balances system, reducing false signals and enhancing the overall reliability of the trading strategy. However, prudent traders also recognize that no indicator or combination thereof is foolproof. Additional factors, such as fundamental analysis and market news, should also be considered to achieve well-rounded trading decisions.
In essence, the Vortex-Based Divergence Indicator's integration with established oscillators like RSI and MACD offers traders a powerful toolkit to navigate complex market landscapes. By leveraging the strengths of each indicator and cross-referencing their insights, traders can elevate their trading strategies to new heights of accuracy and effectiveness.

Dee_MeterHere's how you can effectively use the Dee Meter indicator:
1. **Understanding the Basics**:
- Dee Meter evaluates the market sentiment across various sectors.
- It calculates the overall market trend and presents it in percentage form through a line graph.
2. **Indicator Results**:
- When you add the Dee Meter indicator to your chart, you'll notice two key results: Bull and Bear percentages, along with a line graph.
- The Bull percentage reflects the strength of bullish (positive) sentiment, while the Bear percentage indicates bearish (negative) sentiment.
- For example, if the Bull percentage is 55% and the Bear percentage is 45%, it signifies that the bulls currently have a stronger influence in the market.
3. **Interpreting Percentages**:
- Utilize the Bull and Bear percentages to craft your analysis strategy.
- A high Bull percentage in a bullish market suggests strong bullish momentum.
- In the case of a bullish trend showing signs of weakening (e.g., a double top pattern), monitor the Bull and Bear percentages for early reversal indications.
- A decrease in the Bull percentage and an increase in the Bear percentage could hint at a potential market reversal.
4. **Line Graph Analysis**:
- The line graph visually depicts the strength of bulls (green line) and bears (red line) over time.
- During a bullish trend, the green line rises while the red line remains lower, indicating bullish strength.
- Conversely, during a bearish trend, the red line climbs higher, indicating bearish dominance.
5. **Cross Over and Cross Under**:
- Cross-over and cross-under scenarios occur when the market abruptly reverses direction.
- For instance, in a bullish market that suddenly turns bearish, the red line could cross above the green line, indicating increased bearish power.
- In a bearish market that experiences a sudden influx of buying activity, the green line might cross above the red line, signifying strong buying interest.
6. **Applying the Indicator**:
- Use the Dee Meter to build your own trading strategies and make informed decisions.
- Keep an eye on changes in Bull and Bear percentages to identify shifts in market sentiment.
- Monitor line graph movements to assess the relative strength of bulls and bears.
In summary, the Dee Meter indicator is a valuable tool for assessing market sentiment and confirming trends in the Indian market. By understanding and utilizing the Bull and Bear percentages, line graph analysis, and cross-over/cross-under scenarios, you can develop effective trading strategies and trade with greater confidence.

D-Bot Alpha RSI Breakout StrategyHello dear Traders,
Here is a simple yet effective strategy to use, for best profit higher time frame, such as daily.
Structure of the code
The code defines inputs for SMA (simple moving average) length, RSI (relative strength index) length, RSI entry level, RSI stop loss level, and RSI take profit level. The default values of these variables can be customized as per the user's preferences.
The script calculates SMA and RSI based on the input parameters and the closing price of the asset.
Trading logic
This strategy allows the placement of a long position when:
The RSI crosses above the RSI entry level and
The close price is above the SMA value.
After entering a long position, it applies a trailing stop mechanism. The stop price is updated to the close price if the close price is lower than the last close price.
The script closes the long position when:
RSI falls below the stop loss level.
RSI reaches or exceeds the take profit level.
If the trailing stop is activated (once RSI reaches or exceeds the take profit level), the closing price falls below the trailing stop level.
Strengths
The strategy includes mechanisms for entering a position, taking profit, and stopping losses, which are fundamental aspects of a trading strategy.
It applies a trailing stop mechanism that allows to capture further gains if the price keeps increasing while protecting from losses if the price starts to decrease.
Weaknesses
This strategy only contemplates long positions. Depending on the market situation, the strategy may miss opportunities for short selling when the market is on a downward trend.
The choice of the fixed RSI entry, stop loss, and take profit levels may not be ideal for all market conditions or assets. It might benefit from a more adaptive mechanism that adjusts these levels according to market volatility or trend.
The strategy doesn't factor in trading costs (such as spread or commission), which could have a significant impact on the net profit, especially if the user is trading with a high frequency or in a low liquidity market.
How to trade with this strategy
Given these parameters and the strategy outlined by the code, the trader would enter a long position when the RSI crosses above the RSI entry level (default 34) and the closing price is above the SMA value (SMA calculated with default period of 200). The trader would exit the position when either the RSI falls below the RSI stop loss level (default 30), or RSI rises above the RSI take profit level (default 50), or when the trailing stop is hit.
Remember "The strategies I have prepared are entirely for educational purposes and should not be considered as investment advice. Support your trades using other tools. Wishing everyone profitable trades..."

Ultimate Balance StrategyThe Ultimate Balance Oscillator Strategy harnesses the power of the Ultimate Balance Oscillator to deliver a comprehensive and disciplined approach to trading. By combining the insights of the Rate of Change (ROC), Relative Strength Index (RSI), Commodity Channel Index (CCI), Williams Percent Range, and Average Directional Index (ADX) from TradingView, this strategy offers traders a systematic way to navigate the markets with precision.
The core principle of this strategy lies in its ability to identify optimal entry and exit points based on the movement of the Ultimate Balance Oscillator. When the oscillator line crosses below the 0.75 level, a buy signal is generated, indicating a potential opportunity for a bullish trend reversal. Conversely, when the oscillator line crosses above the 0.25 level, it triggers an exit signal, suggesting a possible end to a bullish trend.
Key Features:
1. Objective Market Analysis: The Ultimate Balance Oscillator Strategy provides a disciplined and objective approach to market analysis. By relying on the quantified insights of multiple indicators, it helps traders cut through market noise and focus on key signals, improving decision-making and reducing emotional biases.
2. Enhanced Timing and Precision: This strategy's entry and exit signals are based on the specific thresholds of the Ultimate Balance Oscillator. By waiting for confirmation through the crossing of these levels, traders can potentially enter trades at opportune moments and exit with greater precision, maximizing profit potential and minimizing risk exposure.
3. Customizability and Adaptability: The strategy offers flexibility, allowing traders to customize the parameters to fit their preferred trading style and timeframes. Whether you're a short-term trader or a long-term investor, the Ultimate Balance Oscillator Strategy can be adjusted to suit your specific needs, making it adaptable to various market conditions.
4. Real-time Alerts: Stay informed and never miss a potential trade opportunity with the strategy's built-in alert system. Set personalized alerts for buy and exit signals to receive timely notifications, ensuring you're always aware of the latest developments in the market.
5. Backtesting and Optimization: Before applying the strategy to live trading, it's recommended to conduct thorough backtesting and optimization. By testing the strategy's performance over historical data and fine-tuning the parameters, you can gain insights into its strengths and weaknesses, enabling you to make informed adjustments and increase its effectiveness.
Trading involves risk. Use the Ultimate Balance Oscillator Strategy at your own discretion. Past performance is not indicative of future results.

Stochastic RSI of Smoothed Price [Loxx]What is Stochastic RSI of Smoothed Price?
This indicator is just as it's title suggests. There are six different signal types, various price smoothing types, and seven types of RSI.
This indicator contains 7 different types of RSI:
RSX
Regular
Slow
Rapid
Harris
Cuttler
Ehlers Smoothed
What is RSI?
RSI stands for Relative Strength Index . It is a technical indicator used to measure the strength or weakness of a financial instrument's price action.
The RSI is calculated based on the price movement of an asset over a specified period of time, typically 14 days, and is expressed on a scale of 0 to 100. The RSI is considered overbought when it is above 70 and oversold when it is below 30.
Traders and investors use the RSI to identify potential buy and sell signals. When the RSI indicates that an asset is oversold, it may be considered a buying opportunity, while an overbought RSI may signal that it is time to sell or take profits.
It's important to note that the RSI should not be used in isolation and should be used in conjunction with other technical and fundamental analysis tools to make informed trading decisions.
What is RSX?
Jurik RSX is a technical analysis indicator that is a variation of the Relative Strength Index Smoothed ( RSX ) indicator. It was developed by Mark Jurik and is designed to help traders identify trends and momentum in the market.
The Jurik RSX uses a combination of the RSX indicator and an adaptive moving average (AMA) to smooth out the price data and reduce the number of false signals. The adaptive moving average is designed to adjust the smoothing period based on the current market conditions, which makes the indicator more responsive to changes in price.
The Jurik RSX can be used to identify potential trend reversals and momentum shifts in the market. It oscillates between 0 and 100, with values above 50 indicating a bullish trend and values below 50 indicating a bearish trend . Traders can use these levels to make trading decisions, such as buying when the indicator crosses above 50 and selling when it crosses below 50.
The Jurik RSX is a more advanced version of the RSX indicator, and while it can be useful in identifying potential trade opportunities, it should not be used in isolation. It is best used in conjunction with other technical and fundamental analysis tools to make informed trading decisions.
What is Slow RSI?
Slow RSI is a variation of the traditional Relative Strength Index ( RSI ) indicator. It is a more smoothed version of the RSI and is designed to filter out some of the noise and short-term price fluctuations that can occur with the standard RSI .
The Slow RSI uses a longer period of time than the traditional RSI , typically 21 periods instead of 14. This longer period helps to smooth out the price data and makes the indicator less reactive to short-term price fluctuations.
Like the traditional RSI , the Slow RSI is used to identify potential overbought and oversold conditions in the market. It oscillates between 0 and 100, with values above 70 indicating overbought conditions and values below 30 indicating oversold conditions. Traders often use these levels as potential buy and sell signals.
The Slow RSI is a more conservative version of the RSI and can be useful in identifying longer-term trends in the market. However, it can also be slower to respond to changes in price, which may result in missed trading opportunities. Traders may choose to use a combination of both the Slow RSI and the traditional RSI to make informed trading decisions.
What is Rapid RSI?
Same as regular RSI but with a faster calculation method
What is Harris RSI?
Harris RSI is a technical analysis indicator that is a variation of the Relative Strength Index ( RSI ). It was developed by Larry Harris and is designed to help traders identify potential trend changes and momentum shifts in the market.
The Harris RSI uses a different calculation formula compared to the traditional RSI . It takes into account both the opening and closing prices of a financial instrument, as well as the high and low prices. The Harris RSI is also normalized to a range of 0 to 100, with values above 50 indicating a bullish trend and values below 50 indicating a bearish trend .
Like the traditional RSI , the Harris RSI is used to identify potential overbought and oversold conditions in the market. It oscillates between 0 and 100, with values above 70 indicating overbought conditions and values below 30 indicating oversold conditions. Traders often use these levels as potential buy and sell signals.
The Harris RSI is a more advanced version of the RSI and can be useful in identifying longer-term trends in the market. However, it can also generate more false signals than the standard RSI . Traders may choose to use a combination of both the Harris RSI and the traditional RSI to make informed trading decisions.
What is Cuttler RSI?
Cuttler RSI is a technical analysis indicator that is a variation of the Relative Strength Index ( RSI ). It was developed by Curt Cuttler and is designed to help traders identify potential trend changes and momentum shifts in the market.
The Cuttler RSI uses a different calculation formula compared to the traditional RSI . It takes into account the difference between the closing price of a financial instrument and the average of the high and low prices over a specified period of time. This difference is then normalized to a range of 0 to 100, with values above 50 indicating a bullish trend and values below 50 indicating a bearish trend .
Like the traditional RSI , the Cuttler RSI is used to identify potential overbought and oversold conditions in the market. It oscillates between 0 and 100, with values above 70 indicating overbought conditions and values below 30 indicating oversold conditions. Traders often use these levels as potential buy and sell signals.
The Cuttler RSI is a more advanced version of the RSI and can be useful in identifying longer-term trends in the market. However, it can also generate more false signals than the standard RSI . Traders may choose to use a combination of both the Cuttler RSI and the traditional RSI to make informed trading decisions.
What is Ehlers Smoothed RSI?
Ehlers smoothed RSI is a technical analysis indicator that is a variation of the Relative Strength Index ( RSI ). It was developed by John Ehlers and is designed to help traders identify potential trend changes and momentum shifts in the market.
The Ehlers smoothed RSI uses a different calculation formula compared to the traditional RSI . It uses a smoothing algorithm that is designed to reduce the noise and random fluctuations that can occur with the standard RSI . The smoothing algorithm is based on a concept called "digital signal processing" and is intended to improve the accuracy of the indicator.
Like the traditional RSI , the Ehlers smoothed RSI is used to identify potential overbought and oversold conditions in the market. It oscillates between 0 and 100, with values above 70 indicating overbought conditions and values below 30 indicating oversold conditions. Traders often use these levels as potential buy and sell signals.
The Ehlers smoothed RSI can be useful in identifying longer-term trends and momentum shifts in the market. However, it can also generate more false signals than the standard RSI . Traders may choose to use a combination of both the Ehlers smoothed RSI and the traditional RSI to make informed trading decisions.
What is Stochastic RSI?
Stochastic RSI (StochRSI) is a technical analysis indicator that combines the concepts of the Stochastic Oscillator and the Relative Strength Index (RSI). It is used to identify potential overbought and oversold conditions in financial markets, as well as to generate buy and sell signals based on the momentum of price movements.
To understand Stochastic RSI, let's first define the two individual indicators it is based on:
Stochastic Oscillator: A momentum indicator that compares a particular closing price of a security to a range of its prices over a certain period. It is used to identify potential trend reversals and generate buy and sell signals.
Relative Strength Index (RSI): A momentum oscillator that measures the speed and change of price movements. It ranges between 0 and 100 and is used to identify overbought or oversold conditions in the market.
Now, let's dive into the Stochastic RSI:
The Stochastic RSI applies the Stochastic Oscillator formula to the RSI values, essentially creating an indicator of an indicator. It helps to identify when the RSI is in overbought or oversold territory with more sensitivity, providing more frequent signals than the standalone RSI.
The formula for StochRSI is as follows:
StochRSI = (RSI - Lowest Low RSI) / (Highest High RSI - Lowest Low RSI)
Where:
RSI is the current RSI value.
Lowest Low RSI is the lowest RSI value over a specified period (e.g., 14 days).
Highest High RSI is the highest RSI value over the same specified period.
StochRSI ranges from 0 to 1, but it is usually multiplied by 100 for easier interpretation, making the range 0 to 100. Like the RSI, values close to 0 indicate oversold conditions, while values close to 100 indicate overbought conditions. However, since the StochRSI is more sensitive, traders typically use 20 as the oversold threshold and 80 as the overbought threshold.
Traders use the StochRSI to generate buy and sell signals by looking for crossovers with a signal line (a moving average of the StochRSI), similar to the way the Stochastic Oscillator is used. When the StochRSI crosses above the signal line, it is considered a bullish signal, and when it crosses below the signal line, it is considered a bearish signal.
It is essential to use the Stochastic RSI in conjunction with other technical analysis tools and indicators, as well as to consider the overall market context, to improve the accuracy and reliability of trading signals.
Signal types included are the following;
Fixed Levels
Floating Levels
Quantile Levels
Fixed Middle
Floating Middle
Quantile Middle
Extras
Alerts
Bar coloring
Loxx's Expanded Source Types

MomentumIndicatorsLibrary "MomentumIndicators"
This is a library of 'Momentum Indicators', also denominated as oscillators.
The purpose of this library is to organize momentum indicators in just one place, making it easy to access.
In addition, it aims to allow customized versions, not being restricted to just the price value.
An example of this use case is the popular Stochastic RSI.
# Indicators:
1. Relative Strength Index (RSI):
Measures the relative strength of recent price gains to recent price losses of an asset.
2. Rate of Change (ROC):
Measures the percentage change in price of an asset over a specified time period.
3. Stochastic Oscillator (Stoch):
Compares the current price of an asset to its price range over a specified time period.
4. True Strength Index (TSI):
Measures the price change, calculating the ratio of the price change (positive or negative) in relation to the
absolute price change.
The values of both are smoothed twice to reduce noise, and the final result is normalized
in a range between 100 and -100.
5. Stochastic Momentum Index (SMI):
Combination of the True Strength Index with a signal line to help identify turning points in the market.
6. Williams Percent Range (Williams %R):
Compares the current price of an asset to its highest high and lowest low over a specified time period.
7. Commodity Channel Index (CCI):
Measures the relationship between an asset's current price and its moving average.
8. Ultimate Oscillator (UO):
Combines three different time periods to help identify possible reversal points.
9. Moving Average Convergence/Divergence (MACD):
Shows the difference between short-term and long-term exponential moving averages.
10. Fisher Transform (FT):
Normalize prices into a Gaussian normal distribution.
11. Inverse Fisher Transform (IFT):
Transform the values of the Fisher Transform into a smaller and more easily interpretable scale is through the
application of an inverse transformation to the hyperbolic tangent function.
This transformation takes the values of the FT, which range from -infinity to +infinity, to a scale limited
between -1 and +1, allowing them to be more easily visualized and compared.
12. Premier Stochastic Oscillator (PSO):
Normalizes the standard stochastic oscillator by applying a five-period double exponential smoothing average of
the %K value, resulting in a symmetric scale of 1 to -1
# Indicators of indicators:
## Stochastic:
1. Stochastic of RSI (Relative Strengh Index)
2. Stochastic of ROC (Rate of Change)
3. Stochastic of UO (Ultimate Oscillator)
4. Stochastic of TSI (True Strengh Index)
5. Stochastic of Williams R%
6. Stochastic of CCI (Commodity Channel Index).
7. Stochastic of MACD (Moving Average Convergence/Divergence)
8. Stochastic of FT (Fisher Transform)
9. Stochastic of Volume
10. Stochastic of MFI (Money Flow Index)
11. Stochastic of On OBV (Balance Volume)
12. Stochastic of PVI (Positive Volume Index)
13. Stochastic of NVI (Negative Volume Index)
14. Stochastic of PVT (Price-Volume Trend)
15. Stochastic of VO (Volume Oscillator)
16. Stochastic of VROC (Volume Rate of Change)
## Inverse Fisher Transform:
1.Inverse Fisher Transform on RSI (Relative Strengh Index)
2.Inverse Fisher Transform on ROC (Rate of Change)
3.Inverse Fisher Transform on UO (Ultimate Oscillator)
4.Inverse Fisher Transform on Stochastic
5.Inverse Fisher Transform on TSI (True Strength Index)
6.Inverse Fisher Transform on CCI (Commodity Channel Index)
7.Inverse Fisher Transform on Fisher Transform (FT)
8.Inverse Fisher Transform on MACD (Moving Average Convergence/Divergence)
9.Inverse Fisher Transfor on Williams R% (Williams Percent Range)
10.Inverse Fisher Transfor on CMF (Chaikin Money Flow)
11.Inverse Fisher Transform on VO (Volume Oscillator)
12.Inverse Fisher Transform on VROC (Volume Rate of Change)
## Stochastic Momentum Index:
1.Stochastic Momentum Index of RSI (Relative Strength Index)
2.Stochastic Momentum Index of ROC (Rate of Change)
3.Stochastic Momentum Index of VROC (Volume Rate of Change)
4.Stochastic Momentum Index of Williams R% (Williams Percent Range)
5.Stochastic Momentum Index of FT (Fisher Transform)
6.Stochastic Momentum Index of CCI (Commodity Channel Index)
7.Stochastic Momentum Index of UO (Ultimate Oscillator)
8.Stochastic Momentum Index of MACD (Moving Average Convergence/Divergence)
9.Stochastic Momentum Index of Volume
10.Stochastic Momentum Index of MFI (Money Flow Index)
11.Stochastic Momentum Index of CMF (Chaikin Money Flow)
12.Stochastic Momentum Index of On Balance Volume (OBV)
13.Stochastic Momentum Index of Price-Volume Trend (PVT)
14.Stochastic Momentum Index of Volume Oscillator (VO)
15.Stochastic Momentum Index of Positive Volume Index (PVI)
16.Stochastic Momentum Index of Negative Volume Index (NVI)
## Relative Strength Index:
1. RSI for Volume
2. RSI for Moving Average
rsi(source, length)
RSI (Relative Strengh Index). Measures the relative strength of recent price gains to recent price losses of an asset.
Parameters:
source : (float) Source of series (close, high, low, etc.)
length : (int) Period of loopback
Returns: (float) Series of RSI
roc(source, length)
ROC (Rate of Change). Measures the percentage change in price of an asset over a specified time period.
Parameters:
source : (float) Source of series (close, high, low, etc.)
length : (int) Period of loopback
Returns: (float) Series of ROC
stoch(kLength, kSmoothing, dSmoothing, maTypeK, maTypeD, almaOffsetKD, almaSigmaKD, lsmaOffSetKD)
Stochastic Oscillator. Compares the current price of an asset to its price range over a specified time period.
Parameters:
kLength
kSmoothing : (int) Period for smoothig stochastic
dSmoothing : (int) Period for signal (moving average of stochastic)
maTypeK : (int) Type of Moving Average for Stochastic Oscillator
maTypeD : (int) Type of Moving Average for Stochastic Oscillator Signal
almaOffsetKD : (float) Offset for Arnaud Legoux Moving Average for Oscillator and Signal
almaSigmaKD : (float) Sigma for Arnaud Legoux Moving Average for Oscillator and Signal
lsmaOffSetKD : (int) Offset for Least Squares Moving Average for Oscillator and Signal
Returns: A tuple of Stochastic Oscillator and Moving Average of Stochastic Oscillator
stoch(source, kLength, kSmoothing, dSmoothing, maTypeK, maTypeD, almaOffsetKD, almaSigmaKD, lsmaOffSetKD)
Stochastic Oscillator. Customized source. Compares the current price of an asset to its price range over a specified time period.
Parameters:
source : (float) Source of series (close, high, low, etc.)
kLength : (int) Period of loopback to calculate the stochastic
kSmoothing : (int) Period for smoothig stochastic
dSmoothing : (int) Period for signal (moving average of stochastic)
maTypeK : (int) Type of Moving Average for Stochastic Oscillator
maTypeD : (int) Type of Moving Average for Stochastic Oscillator Signal
almaOffsetKD : (float) Offset for Arnaud Legoux Moving Average for Stoch and Signal
almaSigmaKD : (float) Sigma for Arnaud Legoux Moving Average for Stoch and Signal
lsmaOffSetKD : (int) Offset for Least Squares Moving Average for Stoch and Signal
Returns: A tuple of Stochastic Oscillator and Moving Average of Stochastic Oscillator
tsi(source, shortLength, longLength, maType, almaOffset, almaSigma, lsmaOffSet)
TSI (True Strengh Index). Measures the price change, calculating the ratio of the price change (positive or negative) in relation to the absolute price change.
The values of both are smoothed twice to reduce noise, and the final result is normalized in a range between 100 and -100.
Parameters:
source : (float) Source of series (close, high, low, etc.)
shortLength : (int) Short length
longLength : (int) Long length
maType : (int) Type of Moving Average for TSI
almaOffset : (float) Offset for Arnaud Legoux Moving Average
almaSigma : (float) Sigma for Arnaud Legoux Moving Average
lsmaOffSet : (int) Offset for Least Squares Moving Average
Returns: (float) TSI
smi(sourceTSI, shortLengthTSI, longLengthTSI, maTypeTSI, almaOffsetTSI, almaSigmaTSI, lsmaOffSetTSI, maTypeSignal, smoothingLengthSignal, almaOffsetSignal, almaSigmaSignal, lsmaOffSetSignal)
SMI (Stochastic Momentum Index). A TSI (True Strengh Index) plus a signal line.
Parameters:
sourceTSI : (float) Source of series for TSI (close, high, low, etc.)
shortLengthTSI : (int) Short length for TSI
longLengthTSI : (int) Long length for TSI
maTypeTSI : (int) Type of Moving Average for Signal of TSI
almaOffsetTSI : (float) Offset for Arnaud Legoux Moving Average
almaSigmaTSI : (float) Sigma for Arnaud Legoux Moving Average
lsmaOffSetTSI : (int) Offset for Least Squares Moving Average
maTypeSignal
smoothingLengthSignal
almaOffsetSignal
almaSigmaSignal
lsmaOffSetSignal
Returns: A tuple with TSI, signal of TSI and histogram of difference
wpr(source, length)
Williams R% (Williams Percent Range). Compares the current price of an asset to its highest high and lowest low over a specified time period.
Parameters:
source : (float) Source of series (close, high, low, etc.)
length : (int) Period of loopback
Returns: (float) Series of Williams R%
cci(source, length, maType, almaOffset, almaSigma, lsmaOffSet)
CCI (Commodity Channel Index). Measures the relationship between an asset's current price and its moving average.
Parameters:
source : (float) Source of series (close, high, low, etc.)
length : (int) Period of loopback
maType : (int) Type of Moving Average
almaOffset : (float) Offset for Arnaud Legoux Moving Average
almaSigma : (float) Sigma for Arnaud Legoux Moving Average
lsmaOffSet : (int) Offset for Least Squares Moving Average
Returns: (float) Series of CCI
ultimateOscillator(fastLength, middleLength, slowLength)
UO (Ultimate Oscilator). Combines three different time periods to help identify possible reversal points.
Parameters:
fastLength : (int) Fast period of loopback
middleLength : (int) Middle period of loopback
slowLength : (int) Slow period of loopback
Returns: (float) Series of Ultimate Oscilator
ultimateOscillator(source, fastLength, middleLength, slowLength)
UO (Ultimate Oscilator). Customized source. Combines three different time periods to help identify possible reversal points.
Parameters:
source : (float) Source of series (close, high, low, etc.)
fastLength : (int) Fast period of loopback
middleLength : (int) Middle period of loopback
slowLength : (int) Slow period of loopback
Returns: (float) Series of Ultimate Oscilator
macd(source, fastLength, slowLength, signalLength, maTypeFast, maTypeSlow, maTypeMACD, almaOffset, almaSigma, lsmaOffSet)
MACD (Moving Average Convergence/Divergence). Shows the difference between short-term and long-term exponential moving averages.
Parameters:
source : (float) Source of series (close, high, low, etc.)
fastLength : (int) Period for fast moving average
slowLength : (int) Period for slow moving average
signalLength : (int) Signal length
maTypeFast : (int) Type of fast moving average
maTypeSlow : (int) Type of slow moving average
maTypeMACD : (int) Type of MACD moving average
almaOffset : (float) Offset for Arnaud Legoux Moving Average
almaSigma : (float) Sigma for Arnaud Legoux Moving Average
lsmaOffSet : (int) Offset for Least Squares Moving Average
Returns: A tuple with MACD, Signal, and Histgram
fisher(length)
Fisher Transform. Normalize prices into a Gaussian normal distribution.
Parameters:
length
Returns: A tuple with Fisher Transform and signal
fisher(source, length)
Fisher Transform. Customized source. Normalize prices into a Gaussian normal distribution.
Parameters:
source : (float) Source of series (close, high, low, etc.)
length
Returns: A tuple with Fisher Transform and signal
inverseFisher(source, length, subtrahend, denominator)
Inverse Fisher Transform.
Transform the values of the Fisher Transform into a smaller and more easily interpretable scale is
through the application of an inverse transformation to the hyperbolic tangent function.
This transformation takes the values of the FT, which range from -infinity to +infinity,
to a scale limited between -1 and +1, allowing them to be more easily visualized and compared.
Parameters:
source : (float) Source of series (close, high, low, etc.)
length : (int) Period for loopback
subtrahend : (int) Denominator. Useful in unbounded indicators. For example, in CCI.
denominator
Returns: (float) Series of Inverse Fisher Transform
premierStoch(length, smoothlen)
Premier Stochastic Oscillator (PSO).
Normalizes the standard stochastic oscillator by applying a five-period double exponential smoothing
average of the %K value, resulting in a symmetric scale of 1 to -1.
Parameters:
length : (int) Period for loopback
smoothlen : (int) Period for smoothing
Returns: (float) Series of PSO
premierStoch(source, smoothlen, subtrahend, denominator)
Premier Stochastic Oscillator (PSO) of custom source.
Normalizes the source by applying a five-period double exponential smoothing average.
Parameters:
source : (float) Source of series (close, high, low, etc.)
smoothlen : (int) Period for smoothing
subtrahend : (int) Denominator. Useful in unbounded indicators. For example, in CCI.
denominator
Returns: (float) Series of PSO
stochRsi(sourceRSI, lengthRSI, kLength, kSmoothing, dSmoothing, maTypeK, maTypeD, almaOffsetKD, almaSigmaKD, lsmaOffSetKD)
Parameters:
sourceRSI
lengthRSI
kLength
kSmoothing
dSmoothing
maTypeK
maTypeD
almaOffsetKD
almaSigmaKD
lsmaOffSetKD
stochRoc(sourceROC, lengthROC, kLength, kSmoothing, dSmoothing, maTypeK, maTypeD, almaOffsetKD, almaSigmaKD, lsmaOffSetKD)
Parameters:
sourceROC
lengthROC
kLength
kSmoothing
dSmoothing
maTypeK
maTypeD
almaOffsetKD
almaSigmaKD
lsmaOffSetKD
stochUO(fastLength, middleLength, slowLength, kLength, kSmoothing, dSmoothing, maTypeK, maTypeD, almaOffsetKD, almaSigmaKD, lsmaOffSetKD)
Parameters:
fastLength
middleLength
slowLength
kLength
kSmoothing
dSmoothing
maTypeK
maTypeD
almaOffsetKD
almaSigmaKD
lsmaOffSetKD
stochTSI(source, shortLength, longLength, maType, almaOffset, almaSigma, lsmaOffSet, kLength, kSmoothing, dSmoothing, maTypeK, maTypeD, almaOffsetKD, almaSigmaKD, lsmaOffSetKD)
Parameters:
source
shortLength
longLength
maType
almaOffset
almaSigma
lsmaOffSet
kLength
kSmoothing
dSmoothing
maTypeK
maTypeD
almaOffsetKD
almaSigmaKD
lsmaOffSetKD
stochWPR(source, length, kLength, kSmoothing, dSmoothing, maTypeK, maTypeD, almaOffsetKD, almaSigmaKD, lsmaOffSetKD)
Parameters:
source
length
kLength
kSmoothing
dSmoothing
maTypeK
maTypeD
almaOffsetKD
almaSigmaKD
lsmaOffSetKD
stochCCI(source, length, maType, almaOffset, almaSigma, lsmaOffSet, kLength, kSmoothing, dSmoothing, maTypeK, maTypeD, almaOffsetKD, almaSigmaKD, lsmaOffSetKD)
Parameters:
source
length
maType
almaOffset
almaSigma
lsmaOffSet
kLength
kSmoothing
dSmoothing
maTypeK
maTypeD
almaOffsetKD
almaSigmaKD
lsmaOffSetKD
stochMACD(source, fastLength, slowLength, signalLength, maTypeFast, maTypeSlow, maTypeMACD, almaOffset, almaSigma, lsmaOffSet, kLength, kSmoothing, dSmoothing, maTypeK, maTypeD, almaOffsetKD, almaSigmaKD, lsmaOffSetKD)
Parameters:
source
fastLength
slowLength
signalLength
maTypeFast
maTypeSlow
maTypeMACD
almaOffset
almaSigma
lsmaOffSet
kLength
kSmoothing
dSmoothing
maTypeK
maTypeD
almaOffsetKD
almaSigmaKD
lsmaOffSetKD
stochFT(length, kLength, kSmoothing, dSmoothing, maTypeK, maTypeD, almaOffsetKD, almaSigmaKD, lsmaOffSetKD)
Parameters:
length
kLength
kSmoothing
dSmoothing
maTypeK
maTypeD
almaOffsetKD
almaSigmaKD
lsmaOffSetKD
stochVolume(kLength, kSmoothing, dSmoothing, maTypeK, maTypeD, almaOffsetKD, almaSigmaKD, lsmaOffSetKD)
Parameters:
kLength
kSmoothing
dSmoothing
maTypeK
maTypeD
almaOffsetKD
almaSigmaKD
lsmaOffSetKD
stochMFI(source, length, kLength, kSmoothing, dSmoothing, maTypeK, maTypeD, almaOffsetKD, almaSigmaKD, lsmaOffSetKD)
Parameters:
source
length
kLength
kSmoothing
dSmoothing
maTypeK
maTypeD
almaOffsetKD
almaSigmaKD
lsmaOffSetKD
stochOBV(source, kLength, kSmoothing, dSmoothing, maTypeK, maTypeD, almaOffsetKD, almaSigmaKD, lsmaOffSetKD)
Parameters:
source
kLength
kSmoothing
dSmoothing
maTypeK
maTypeD
almaOffsetKD
almaSigmaKD
lsmaOffSetKD
stochPVI(source, kLength, kSmoothing, dSmoothing, maTypeK, maTypeD, almaOffsetKD, almaSigmaKD, lsmaOffSetKD)
Parameters:
source
kLength
kSmoothing
dSmoothing
maTypeK
maTypeD
almaOffsetKD
almaSigmaKD
lsmaOffSetKD
stochNVI(source, kLength, kSmoothing, dSmoothing, maTypeK, maTypeD, almaOffsetKD, almaSigmaKD, lsmaOffSetKD)
Parameters:
source
kLength
kSmoothing
dSmoothing
maTypeK
maTypeD
almaOffsetKD
almaSigmaKD
lsmaOffSetKD
stochPVT(source, kLength, kSmoothing, dSmoothing, maTypeK, maTypeD, almaOffsetKD, almaSigmaKD, lsmaOffSetKD)
Parameters:
source
kLength
kSmoothing
dSmoothing
maTypeK
maTypeD
almaOffsetKD
almaSigmaKD
lsmaOffSetKD
stochVO(shortLen, longLen, maType, almaOffset, almaSigma, lsmaOffSet, kLength, kSmoothing, dSmoothing, maTypeK, maTypeD, almaOffsetKD, almaSigmaKD, lsmaOffSetKD)
Parameters:
shortLen
longLen
maType
almaOffset
almaSigma
lsmaOffSet
kLength
kSmoothing
dSmoothing
maTypeK
maTypeD
almaOffsetKD
almaSigmaKD
lsmaOffSetKD
stochVROC(length, kLength, kSmoothing, dSmoothing, maTypeK, maTypeD, almaOffsetKD, almaSigmaKD, lsmaOffSetKD)
Parameters:
length
kLength
kSmoothing
dSmoothing
maTypeK
maTypeD
almaOffsetKD
almaSigmaKD
lsmaOffSetKD
iftRSI(sourceRSI, lengthRSI, lengthIFT)
Parameters:
sourceRSI
lengthRSI
lengthIFT
iftROC(sourceROC, lengthROC, lengthIFT)
Parameters:
sourceROC
lengthROC
lengthIFT
iftUO(fastLength, middleLength, slowLength, lengthIFT)
Parameters:
fastLength
middleLength
slowLength
lengthIFT
iftStoch(kLength, kSmoothing, dSmoothing, maTypeK, maTypeD, almaOffsetKD, almaSigmaKD, lsmaOffSetKD, lengthIFT)
Parameters:
kLength
kSmoothing
dSmoothing
maTypeK
maTypeD
almaOffsetKD
almaSigmaKD
lsmaOffSetKD
lengthIFT
iftTSI(source, shortLength, longLength, maType, almaOffset, almaSigma, lsmaOffSet, lengthIFT)
Parameters:
source
shortLength
longLength
maType
almaOffset
almaSigma
lsmaOffSet
lengthIFT
iftCCI(source, length, maType, almaOffset, almaSigma, lsmaOffSet, lengthIFT)
Parameters:
source
length
maType
almaOffset
almaSigma
lsmaOffSet
lengthIFT
iftFisher(length, lengthIFT)
Parameters:
length
lengthIFT
iftMACD(source, fastLength, slowLength, signalLength, maTypeFast, maTypeSlow, maTypeMACD, almaOffset, almaSigma, lsmaOffSet, lengthIFT)
Parameters:
source
fastLength
slowLength
signalLength
maTypeFast
maTypeSlow
maTypeMACD
almaOffset
almaSigma
lsmaOffSet
lengthIFT
iftWPR(source, length, lengthIFT)
Parameters:
source
length
lengthIFT
iftMFI(source, length, lengthIFT)
Parameters:
source
length
lengthIFT
iftCMF(length, lengthIFT)
Parameters:
length
lengthIFT
iftVO(shortLen, longLen, maType, almaOffset, almaSigma, lsmaOffSet, lengthIFT)
Parameters:
shortLen
longLen
maType
almaOffset
almaSigma
lsmaOffSet
lengthIFT
iftVROC(length, lengthIFT)
Parameters:
length
lengthIFT
smiRSI(source, length, shortLengthTSI, longLengthTSI, maTypeTSI, almaOffsetTSI, almaSigmaTSI, lsmaOffSetTSI, maTypeSignal, smoothingLengthSignal, almaOffsetSignal, almaSigmaSignal, lsmaOffSetSignal)
Parameters:
source
length
shortLengthTSI
longLengthTSI
maTypeTSI
almaOffsetTSI
almaSigmaTSI
lsmaOffSetTSI
maTypeSignal
smoothingLengthSignal
almaOffsetSignal
almaSigmaSignal
lsmaOffSetSignal
smiROC(source, length, shortLengthTSI, longLengthTSI, maTypeTSI, almaOffsetTSI, almaSigmaTSI, lsmaOffSetTSI, maTypeSignal, smoothingLengthSignal, almaOffsetSignal, almaSigmaSignal, lsmaOffSetSignal)
Parameters:
source
length
shortLengthTSI
longLengthTSI
maTypeTSI
almaOffsetTSI
almaSigmaTSI
lsmaOffSetTSI
maTypeSignal
smoothingLengthSignal
almaOffsetSignal
almaSigmaSignal
lsmaOffSetSignal
smiVROC(length, shortLengthTSI, longLengthTSI, maTypeTSI, almaOffsetTSI, almaSigmaTSI, lsmaOffSetTSI, maTypeSignal, smoothingLengthSignal, almaOffsetSignal, almaSigmaSignal, lsmaOffSetSignal)
Parameters:
length
shortLengthTSI
longLengthTSI
maTypeTSI
almaOffsetTSI
almaSigmaTSI
lsmaOffSetTSI
maTypeSignal
smoothingLengthSignal
almaOffsetSignal
almaSigmaSignal
lsmaOffSetSignal
smiWPR(source, length, shortLengthTSI, longLengthTSI, maTypeTSI, almaOffsetTSI, almaSigmaTSI, lsmaOffSetTSI, maTypeSignal, smoothingLengthSignal, almaOffsetSignal, almaSigmaSignal, lsmaOffSetSignal)
Parameters:
source
length
shortLengthTSI
longLengthTSI
maTypeTSI
almaOffsetTSI
almaSigmaTSI
lsmaOffSetTSI
maTypeSignal
smoothingLengthSignal
almaOffsetSignal
almaSigmaSignal
lsmaOffSetSignal
smiFT(length, shortLengthTSI, longLengthTSI, maTypeTSI, almaOffsetTSI, almaSigmaTSI, lsmaOffSetTSI, maTypeSignal, smoothingLengthSignal, almaOffsetSignal, almaSigmaSignal, lsmaOffSetSignal)
Parameters:
length
shortLengthTSI
longLengthTSI
maTypeTSI
almaOffsetTSI
almaSigmaTSI
lsmaOffSetTSI
maTypeSignal
smoothingLengthSignal
almaOffsetSignal
almaSigmaSignal
lsmaOffSetSignal
smiFT(source, length, shortLengthTSI, longLengthTSI, maTypeTSI, almaOffsetTSI, almaSigmaTSI, lsmaOffSetTSI, maTypeSignal, smoothingLengthSignal, almaOffsetSignal, almaSigmaSignal, lsmaOffSetSignal)
Parameters:
source
length
shortLengthTSI
longLengthTSI
maTypeTSI
almaOffsetTSI
almaSigmaTSI
lsmaOffSetTSI
maTypeSignal
smoothingLengthSignal
almaOffsetSignal
almaSigmaSignal
lsmaOffSetSignal
smiCCI(source, length, maTypeCCI, almaOffsetCCI, almaSigmaCCI, lsmaOffSetCCI, shortLengthTSI, longLengthTSI, maTypeTSI, almaOffsetTSI, almaSigmaTSI, lsmaOffSetTSI, maTypeSignal, smoothingLengthSignal, almaOffsetSignal, almaSigmaSignal, lsmaOffSetSignal)
Parameters:
source
length
maTypeCCI
almaOffsetCCI
almaSigmaCCI
lsmaOffSetCCI
shortLengthTSI
longLengthTSI
maTypeTSI
almaOffsetTSI
almaSigmaTSI
lsmaOffSetTSI
maTypeSignal
smoothingLengthSignal
almaOffsetSignal
almaSigmaSignal
lsmaOffSetSignal
smiUO(fastLength, middleLength, slowLength, shortLengthTSI, longLengthTSI, maTypeTSI, almaOffsetTSI, almaSigmaTSI, lsmaOffSetTSI, maTypeSignal, smoothingLengthSignal, almaOffsetSignal, almaSigmaSignal, lsmaOffSetSignal)
Parameters:
fastLength
middleLength
slowLength
shortLengthTSI
longLengthTSI
maTypeTSI
almaOffsetTSI
almaSigmaTSI
lsmaOffSetTSI
maTypeSignal
smoothingLengthSignal
almaOffsetSignal
almaSigmaSignal
lsmaOffSetSignal
smiMACD(source, fastLength, slowLength, signalLength, maTypeFast, maTypeSlow, maTypeMACD, almaOffset, almaSigma, lsmaOffSet, shortLengthTSI, longLengthTSI, maTypeTSI, almaOffsetTSI, almaSigmaTSI, lsmaOffSetTSI, maTypeSignal, smoothingLengthSignal, almaOffsetSignal, almaSigmaSignal, lsmaOffSetSignal)
Parameters:
source
fastLength
slowLength
signalLength
maTypeFast
maTypeSlow
maTypeMACD
almaOffset
almaSigma
lsmaOffSet
shortLengthTSI
longLengthTSI
maTypeTSI
almaOffsetTSI
almaSigmaTSI
lsmaOffSetTSI
maTypeSignal
smoothingLengthSignal
almaOffsetSignal
almaSigmaSignal
lsmaOffSetSignal
smiVol(shortLengthTSI, longLengthTSI, maTypeTSI, almaOffsetTSI, almaSigmaTSI, lsmaOffSetTSI, maTypeSignal, smoothingLengthSignal, almaOffsetSignal, almaSigmaSignal, lsmaOffSetSignal)
Parameters:
shortLengthTSI
longLengthTSI
maTypeTSI
almaOffsetTSI
almaSigmaTSI
lsmaOffSetTSI
maTypeSignal
smoothingLengthSignal
almaOffsetSignal
almaSigmaSignal
lsmaOffSetSignal
smiMFI(source, length, shortLengthTSI, longLengthTSI, maTypeTSI, almaOffsetTSI, almaSigmaTSI, lsmaOffSetTSI, maTypeSignal, smoothingLengthSignal, almaOffsetSignal, almaSigmaSignal, lsmaOffSetSignal)
Parameters:
source
length
shortLengthTSI
longLengthTSI
maTypeTSI
almaOffsetTSI
almaSigmaTSI
lsmaOffSetTSI
maTypeSignal
smoothingLengthSignal
almaOffsetSignal
almaSigmaSignal
lsmaOffSetSignal
smiCMF(length, shortLengthTSI, longLengthTSI, maTypeTSI, almaOffsetTSI, almaSigmaTSI, lsmaOffSetTSI, maTypeSignal, smoothingLengthSignal, almaOffsetSignal, almaSigmaSignal, lsmaOffSetSignal)
Parameters:
length
shortLengthTSI
longLengthTSI
maTypeTSI
almaOffsetTSI
almaSigmaTSI
lsmaOffSetTSI
maTypeSignal
smoothingLengthSignal
almaOffsetSignal
almaSigmaSignal
lsmaOffSetSignal
smiOBV(source, shortLengthTSI, longLengthTSI, maTypeTSI, almaOffsetTSI, almaSigmaTSI, lsmaOffSetTSI, maTypeSignal, smoothingLengthSignal, almaOffsetSignal, almaSigmaSignal, lsmaOffSetSignal)
Parameters:
source
shortLengthTSI
longLengthTSI
maTypeTSI
almaOffsetTSI
almaSigmaTSI
lsmaOffSetTSI
maTypeSignal
smoothingLengthSignal
almaOffsetSignal
almaSigmaSignal
lsmaOffSetSignal
smiPVT(source, shortLengthTSI, longLengthTSI, maTypeTSI, almaOffsetTSI, almaSigmaTSI, lsmaOffSetTSI, maTypeSignal, smoothingLengthSignal, almaOffsetSignal, almaSigmaSignal, lsmaOffSetSignal)
Parameters:
source
shortLengthTSI
longLengthTSI
maTypeTSI
almaOffsetTSI
almaSigmaTSI
lsmaOffSetTSI
maTypeSignal
smoothingLengthSignal
almaOffsetSignal
almaSigmaSignal
lsmaOffSetSignal
smiVO(shortLen, longLen, maType, almaOffset, almaSigma, lsmaOffSet, shortLengthTSI, longLengthTSI, maTypeTSI, almaOffsetTSI, almaSigmaTSI, lsmaOffSetTSI, maTypeSignal, smoothingLengthSignal, almaOffsetSignal, almaSigmaSignal, lsmaOffSetSignal)
Parameters:
shortLen
longLen
maType
almaOffset
almaSigma
lsmaOffSet
shortLengthTSI
longLengthTSI
maTypeTSI
almaOffsetTSI
almaSigmaTSI
lsmaOffSetTSI
maTypeSignal
smoothingLengthSignal
almaOffsetSignal
almaSigmaSignal
lsmaOffSetSignal
smiPVI(source, shortLengthTSI, longLengthTSI, maTypeTSI, almaOffsetTSI, almaSigmaTSI, lsmaOffSetTSI, maTypeSignal, smoothingLengthSignal, almaOffsetSignal, almaSigmaSignal, lsmaOffSetSignal)
Parameters:
source
shortLengthTSI
longLengthTSI
maTypeTSI
almaOffsetTSI
almaSigmaTSI
lsmaOffSetTSI
maTypeSignal
smoothingLengthSignal
almaOffsetSignal
almaSigmaSignal
lsmaOffSetSignal
smiNVI(source, shortLengthTSI, longLengthTSI, maTypeTSI, almaOffsetTSI, almaSigmaTSI, lsmaOffSetTSI, maTypeSignal, smoothingLengthSignal, almaOffsetSignal, almaSigmaSignal, lsmaOffSetSignal)
Parameters:
source
shortLengthTSI
longLengthTSI
maTypeTSI
almaOffsetTSI
almaSigmaTSI
lsmaOffSetTSI
maTypeSignal
smoothingLengthSignal
almaOffsetSignal
almaSigmaSignal
lsmaOffSetSignal
rsiVolume(length)
Parameters:
length
rsiMA(sourceMA, lengthMA, maType, almaOffset, almaSigma, lsmaOffSet, lengthRSI)
Parameters:
sourceMA
lengthMA
maType
almaOffset
almaSigma
lsmaOffSet
lengthRSI

Poly Cycle [Loxx]This is an example of what can be done by combining Legendre polynomials and analytic signals. I get a way of determining a smooth period and relative adaptive strength indicator without adding time lag.
This indicator displays the following:
The Least Squares fit of a polynomial to a DC subtracted time series - a best fit to a cycle.
The normalized analytic signal of the cycle (signal and quadrature).
The Phase shift of the analytic signal per bar.
The Period and HalfPeriod lengths, in bars of the current cycle.
A relative strength indicator of the time series over the cycle length. That is, adaptive relative strength over the cycle length.
The Relative Strength Indicator, is adaptive to the time series, and it can be smoothed by increasing the length of decreasing the number of degrees of freedom.
Other adaptive indicators based upon the period and can be similarly constructed.
There is some new math here, so I have broken the story up into 5 Parts:
Part 1:
Any time series can be decomposed into a orthogonal set of polynomials .
This is just math and here are some good references:
Legendre polynomials - Wikipedia, the free encyclopedia
Peter Seffen, "On Digital Smoothing Filters: A Brief Review of Closed Form Solutions and Two New Filter Approaches", Circuits Systems Signal Process, Vol. 5, No 2, 1986
I gave some thought to what should be done with this and came to the conclusion that they can be used for basic smoothing of time series. For the analysis below, I decompose a time series into a low number of degrees of freedom and discard the zero mode to introduce smoothing.
That is:
time series => c_1 t + c_2 t^2 ... c_Max t^Max
This is the cycle. By construction, the cycle does not have a zero mode and more physically, I am defining the "Trend" to be the zero mode.
The data for the cycle and the fit of the cycle can be viewed by setting
ShowDataAndFit = TRUE;
There, you will see the fit of the last bar as well as the time series of the leading edge of the fits. If you don't know what I mean by the "leading edge", please see some of the postings in . The leading edges are in grayscale, and the fit of the last bar is in color.
I have chosen Length = 17 and Degree = 4 as the default. I am simply making sure by eye that the fit is reasonably good and degree 4 is the lowest polynomial that can represent a sine-like wave, and 17 is the smallest length that lets me calculate the Phase Shift (Part 3 below) using the Hilbert Transform of width=7 (Part 2 below).
Depending upon the fit you make, you will capture different cycles in the data. A fit that is too "smooth" will not see the smaller cycles, and a fit that is too "choppy" will not see the longer ones. The idea is to use the fit to try to suppress the smaller noise cycles while keeping larger signal cycles.
Part 2:
Every time series has an Analytic Signal, defined by applying the Hilbert Transform to it. You can think of the original time series as amplitude * cosine(theta) and the transformed series, called the quadrature, can be thought of as amplitude * sine(theta). By taking the ratio, you can get the angle theta, and this is exactly what was done by John Ehlers in . It lets you get a frequency out of the time series under consideration.
Amazon.com: Rocket Science for Traders: Digital Signal Processing Applications (9780471405672): John F. Ehlers: Books
It helps to have more references to understand this. There is a nice article on Wikipedia on it.
Read the part about the discrete Hilbert Transform:
en.wikipedia.org
If you really want to understand how to go from continuous to discrete, look up this article written by Richard Lyons:
www.dspguru.com
In the indicator below, I am calculating the normalized analytic signal, which can be written as:
s + i h where i is the imagery number, and s^2 + h^2 = 1;
s= signal = cosine(theta)
h = Hilbert transformed signal = quadrature = sine(theta)
The angle is therefore given by theta = arctan(h/s);
The analytic signal leading edge and the fit of the last bar of the cycle can be viewed by setting
ShowAnalyticSignal = TRUE;
The leading edges are in grayscale fit to the last bar is in color. Light (yellow) is the s term, and Dark (orange) is the quadrature (hilbert transform). Note that for every bar, s^2 + h^2 = 1 , by construction.
I am using a width = 7 Hilbert transform, just like Ehlers. (But you can adjust it if you want.) This transform has a 7 bar lag. I have put the lag into the plot statements, so the cycle info should be quite good at displaying minima and maxima (extrema).
Part 3:
The Phase shift is the amount of phase change from bar to bar.
It is a discrete unitary transformation that takes s + i h to s + i h
explicitly, T = (s+ih)*(s -ih ) , since s *s + h *h = 1.
writing it out, we find that T = T1 + iT2
where T1 = s*s + h*h and T2 = s*h -h*s
and the phase shift is given by PhaseShift = arctan(T2/T1);
Alas, I have no reference for this, all I doing is finding the rotation what takes the analytic signal at bar to the analytic signal at bar . T is the transfer matrix.
Of interest is the PhaseShift from the closest two bars to the present, given by the bar and bar since I am using a width=7 Hilbert transform, bar is the earliest bar with an analytic signal.
I store the phase shift from bar to bar as a time series called PhaseShift. It basically gives you the (7-bar delayed) leading edge the amount of phase angle change in the series.
You can see it by setting
ShowPhaseShift=TRUE
The green points are positive phase shifts and red points are negative phase shifts.
On most charts, I have looked at, the indicator is mostly green, but occasionally, the stock "retrogrades" and red appears. This happens when the cycle is "broken" and the cycle length starts to expand as a trend occurs.
Part 4:
The Period:
The Period is the number of bars required to generate a sum of PhaseShifts equal to 360 degrees.
The Half-period is the number of bars required to generate a sum of phase shifts equal to 180 degrees. It is usually not equal to 1/2 of the period.
You can see the Period and Half-period by setting
ShowPeriod=TRUE
The code is very simple here:
Value1=0;
Value2=0;
while Value1 < bar_index and math.abs(Value2) < 360 begin
Value2 = Value2 + PhaseShift ;
Value1 = Value1 + 1;
end;
Period = Value1;
The period is sensitive to the input length and degree values but not overly so. Any insight on this would be appreciated.
Part 5:
The Relative Strength indicator:
The Relative Strength is just the current value of the series minus the minimum over the last cycle divided by the maximum - minimum over the last cycle, normalized between +1 and -1.
RelativeStrength = -1 + 2*(Series-Min)/(Max-Min);
It therefore tells you where the current bar is relative to the cycle. If you want to smooth the indicator, then extend the period and/or reduce the polynomial degree.
In code:
NewLength = floor(Period + HilbertWidth+1);
Max = highest(Series,NewLength);
Min = lowest(Series,NewLength);
if Max>Min then
Note that the variable NewLength includes the lag that comes from the Hilbert transform, (HilbertWidth=7 by default).
Conclusion:
This is an example of what can be done by combining Legendre polynomials and analytic signals to determine a smooth period without adding time lag.
________________________________
Changes in this one : instead of using true/false options for every single way to display, use Type parameter as following :
1. The Least Squares fit of a polynomial to a DC subtracted time series - a best fit to a cycle.
2. The normalized analytic signal of the cycle (signal and quadrature).
3. The Phase shift of the analytic signal per bar.
4. The Period and HalfPeriod lengths, in bars of the current cycle.
5. A relative strength indicator of the time series over the cycle length. That is, adaptive relative strength over the cycle length.

EM_RSI Gradient Candles
I've missed the beautiful trend visualization of Heiken Ashi candles ever since I first learned they don't play well with other indicators largely due to the method with which they're plotted.
I wanted to color code a gradient onto candles to help visualize trend strength, and the Relative Strength Index was the first thing to come to mind. For coloring, it's possible the new color.from_gradient function would have worked, but I couldn't guarantee a highly customizable indicator with a single gradient so I took a more classic approach.
First, RSI was calculated using Tradingview's built-in RSI code.
Then I broke down the RSI's range of 1-100 into 10 tiers and assigned each a color option with the ability to turn any particular tier off if desired.
I found it to be extremely modular and helpful in visualizing both trend strength and identifying potential trend reversals due to a reduction in strength.
You can use it on every candle to help inform decisions, or keep all but <10 and >90 turned off so that it only changes candle color during the most extreme trends.
Or anything in between!
This is my first self-coded indicator so I'm already proud.
Please let me know what you think, and feel free to suggest improvements for future versions in the comments!

Non-Rescaled RSI█ OVERVIEW
Relative Strength Index is a momentum oscillator developed by J. Wilder. The original version of RSI rescaled the relative strength measurement to range. While the rescaling is useful for readability, This non-rescaled version tells the exact average relative strength of the movement for the past period, and give another way to put the relative strength reading into context of current market condition.
█ Description & How To Use
1. The (+/-) in relative strength value indicates the direction
Example 1: Relative Strength of 2.33 means average gain is 2.33 bigger than average loss for the past period (Equivalent to RSI 70)
Example 2: Relative Strength of -2.33 means average loss is 2.33 bigger than average gain for the past period (Equivalent to RSI 30)
Example 3: Relative Strength of 0 means average gain is equal to average loss for the past period (Equivalent to RSI 50)
Look at comparison below:
2. You can use it exactly how you would use RSI: Overbought/Oversold state, Divergence, Trend identification, Failure Swings etc..
█ Features
- Overbought/Oversold line still maintainable as standard RSI level (70,30) in user input screen. The script will recalculate and plot the ob/os level accordingly
- Value Label to indicate the RSI and RS value
- Custom Gradient Color Scheme
█ Limitation
The Relative Strength absolute value is capped at 20 to avoid ratio value too big(or too small). This is enough to get accurate equivalent of RSI reading between 5-95
█ Disclaimer
Past performance is not an indicator of future results.
My opinions and research are my own and do not constitute financial advice in any way whatsoever.
Nothing published by me constitutes an investment/trading recommendation, nor should any data or Content published by me be relied upon for any investment/trading activities.
I strongly recommends that you perform your own independent research and/or speak with a qualified investment professional before making any financial decisions.
